I’m wondering what the established methods would be for the following scenario:
You generate data in your own assembly and dump it into an XyDataSeries and point or line render series with an IChartSeriesViewModel object and bind that using the SeriesSource api.
But it is relatively common to have additional metdata about a given datapoint that is keyed to something other than an X or Y value. For example, the plot may be based on the a computed number that is independent of a time value, but you still want to display the time value for that chart in the rollover tooltip.
What are the options for dealing with this in scichart?
Best and thanks!
- dsantimore asked 10 years ago
- You must login to post comments
UPDATE: SciChart v4 Now Supports PointMetadata Natively
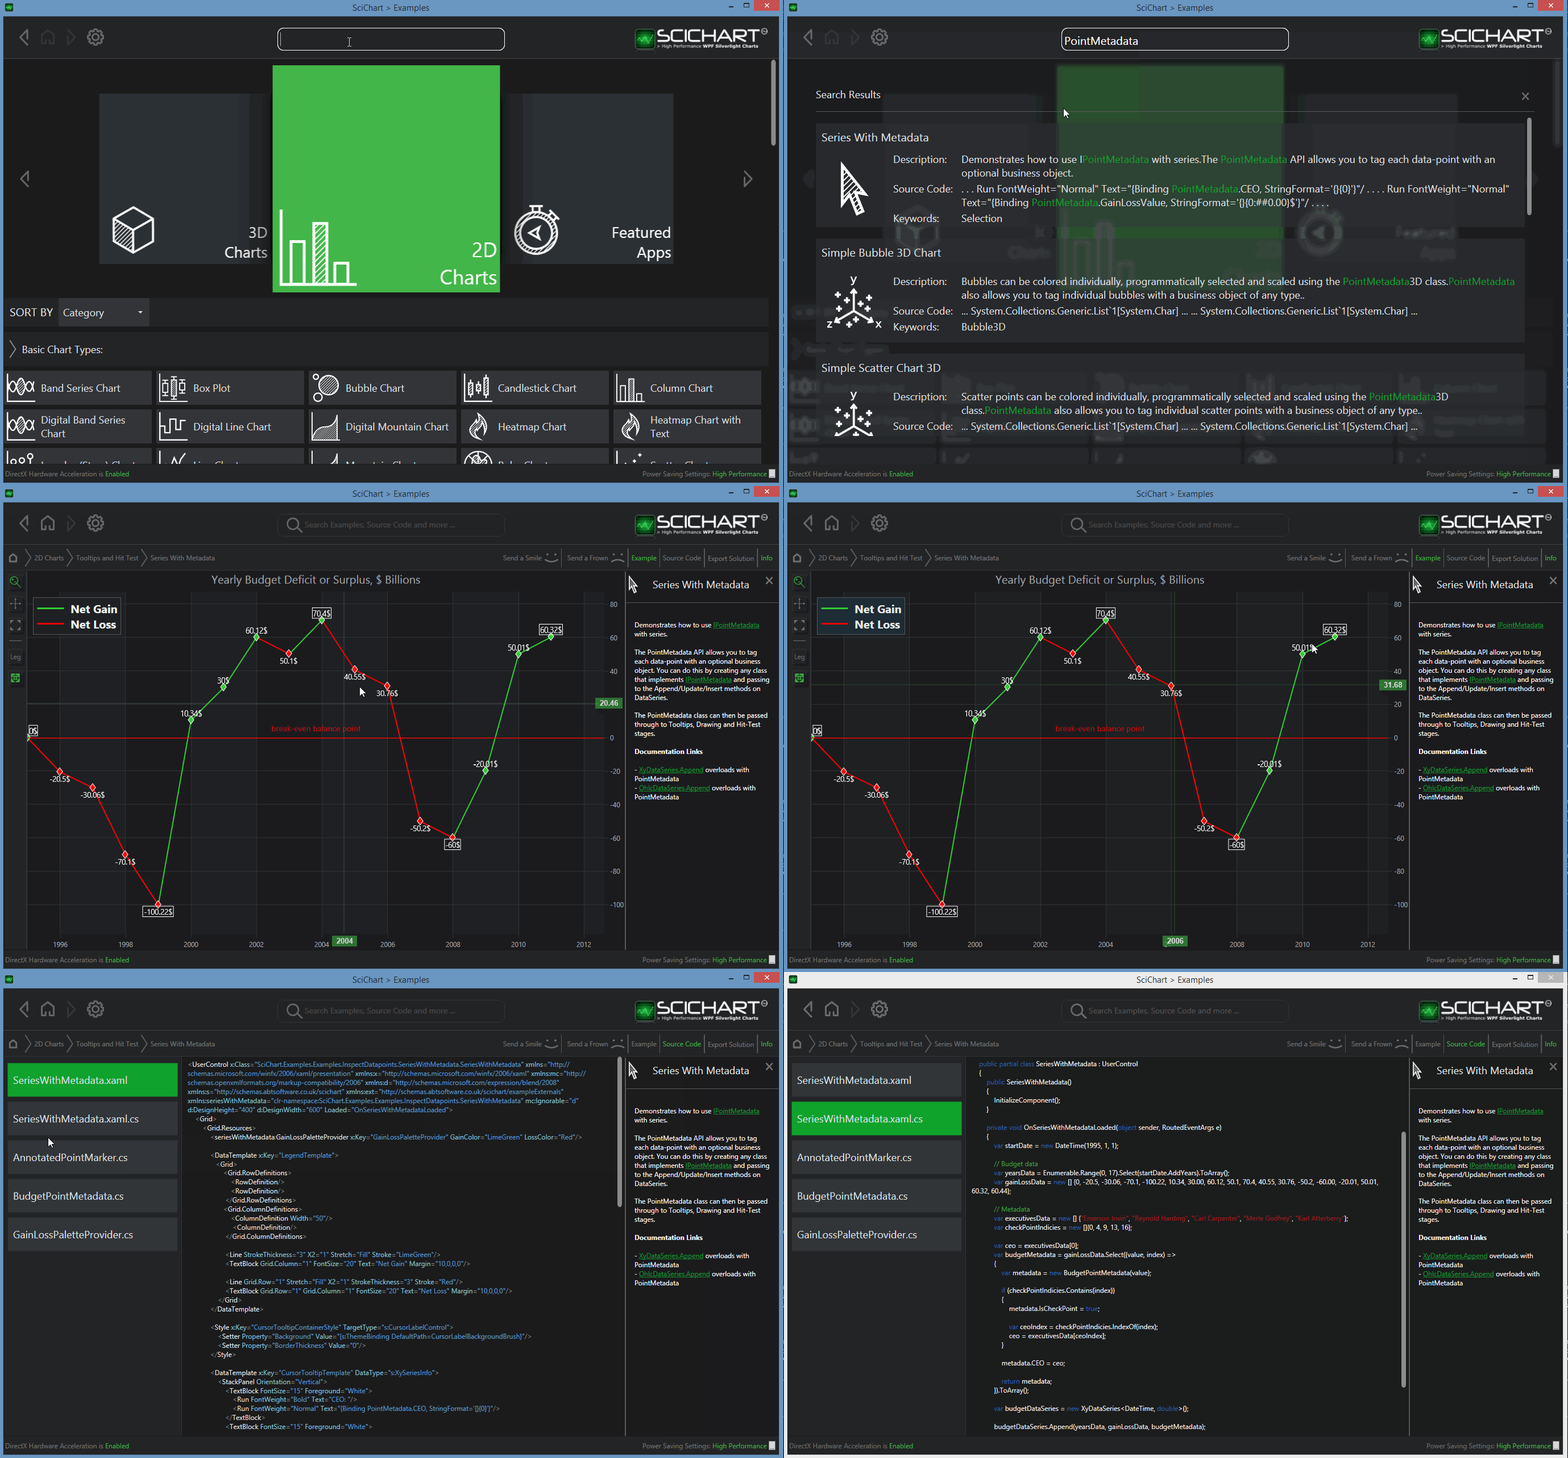
You will be pleased to know, in SciChart v4 we have included the new PointMetadata API natively.
This allows you to tag any data-point with a class of your choice (implementing IPointMetadata interface) and pass through to tooltips and hit-test.
Demo
There is a full example in our SciChart v4 WPF Examples Suite -> Tooltips and Hit Test -> Series with Metadata

Example
// Create the IPointMetadata derived type
public class MyMetadata : IPointMetadata
{
   public event PropertyChangedEventHandler PropertyChanged;

   public MyMetadata(string label)
   {
      this.Label = label;
   }

   public bool IsSelected { get; set; }
   public string Label { get; set; }
}

// Append it to DataSeries
void Foo()
{
   var xyDataSeries = new XyDataSeries<double>();
   xyDataSeries.Append(0, 10, new MyMetadata("Hello"));
   xyDataSeries.Append(1, 20, null);
   xyDataSeries.Append(2, 30, new MyMetadata("World!"));
}
Throughout SciChart v4 you can now bind to PointMetadata in tooltips, get PointMetadata in PaletteProviders and access via the DataSeries.Metadata column.
Best regards,
Andrew
- Andrew Burnett-Thompson answered 8 years ago
- last edited 8 years ago
- You must login to post comments
You know I have another idea for you, and it might just work.
Try using our XyzDataSeries. If you bind this to a RenderableSeries (e.g. a line or scatter series) it will by default using the XY values for drawing. The Z values are superfluous.
On Hit-Test you could show the Z-values as well as X and Y.
If you wanted just a time value, then store this in the Z. If however you wanted a more complex object (e.g. Metadata or ViewModel) you could store an index in here and have a separate array or list of ViewModels that you index.
In fact, I seem to remember this being asked before. So we have a sample in our TestSuite which does both storing Z-States in metadata and RolloverLabel Templating. Please see the attached.
If you have any questions please let us know!
Andrew
- Andrew Burnett-Thompson answered 10 years ago
- You must login to post comments
OK, for the archives, in case someone doesn’t have enough reading to do:
So this was not the simplest of issues to solve, though perhaps I made it more complex than it needed to be. The basic requirement was that I had to find a way to get arbitrary metadata into a tooltip based on the results invoked by a viewmodel method, when that metadata had no
I ended up creating a SortedList in which I store my series data (I have a lot of pre-processing to do). DataPoint, and one of its properties, DataPointMetadata, are both structs.
Now, RolloverModifer generates the SeriesInfo DTO, which contains the DataSeriesIndex property — as far as I can tell, the index of the datapoint in SciChart’s underlying collection. This, along with the SeriesName, allow me to uniquely identify a datapoint in very quick time.
The remaining challenge is find a way to look up the value using the viewmodel from inside RolloverModifier.ToolTipLabelTemplate. One option was to use MultiBinding, but I’m not sure that would have worked. I instead decided to use a BindingProxy technique and pass the viewmodel as a staticresource to the converter which is responsible for realizing the data.
<scichart:RolloverModifier
    x:Name="rollover"
    DrawVerticalLine="False"
    ShowAxisLabels="False"
    SourceMode="AllVisibleSeries"
    ShowTooltipOn="MouseRightButtonDown"
    >
    <scichart:RolloverModifier.TooltipLabelTemplate>
        <ControlTemplate>
            <Border x:Name="bdToolTip"
                BorderThickness="1.25"
                Background="#341B0B" Opacity="0.85"
                    >
                <Border.Resources>
                    <Style TargetType="{x:Type TextBlock}">
                        <Setter Property="FontSize" Value="12" />
                        <Setter Property="Margin" Value="3" />
                    </Style>
                </Border.Resources>
                <Border.BorderBrush>
                    <StaticResource ResourceKey="bControlAltBackground"/>
                </Border.BorderBrush>
                <Grid >
                    <Grid.RowDefinitions>
                        <RowDefinition />
                        <RowDefinition />
                        <RowDefinition />
                        <RowDefinition />
                    </Grid.RowDefinitions>
                    <Grid.ColumnDefinitions>
                        <ColumnDefinition Width="Auto" />
                        <ColumnDefinition />
                    </Grid.ColumnDefinitions>

                    <TextBlock Grid.Row="0" Grid.ColumnSpan="2" Text="{Binding SeriesName}" />
                    <TextBlock Grid.Row="1" Grid.Column="0" Text="X: " />
                    <TextBlock Grid.Row="1" Grid.Column="1"
                        Text="{Binding XValue, Converter={StaticResource convIComparable}, StringFormat=\{0:N3\}}"
                                                                    />

                    <TextBlock Grid.Row="2" Grid.Column="0" Text="Y: " />
                    <TextBlock Grid.Row="2" Grid.Column="1"
                        Text="{Binding YValue, Converter={StaticResource convIComparable}, StringFormat=\{0:N3\}}" />

                    <!-- A UC that shows the specially-retrieved metadata -->
                    <uc:DataPointMetadata Grid.Row="3" Grid.ColumnSpan="2"
                                          DataContext="{Binding
                                                        Converter={StaticResource convSeriesInfoToMetadata},
                                                        ConverterParameter={StaticResource proxy},
                                                        Mode=OneWay}"
                                          />

                </Grid>
            </Border>
        </ControlTemplate>
    </scichart:RolloverModifier.TooltipLabelTemplate>
</scichart:RolloverModifier>
/// <summary>
/// Converts a SeriesInfo Object to a <c>DataPointMetadata</c> struct
/// by invoking a method on the viewmodel. One way only.
/// </summary>
public class SeriesInfoToMetadataConverter : IValueConverter
{
    public object Convert(object value, Type targetType, object parameter, System.Globalization.CultureInfo culture)
    {
        //cast to viewmodel from proxy
        var vmodel = (vm.SciChartPlotViewModel)((lib.BindingProxy)parameter).Data;

        //cast to SeriesInfo from value
        var si = (Abt.Controls.SciChart.SeriesInfo)value;

        //retrieve metadata using viewmodel; viewmodel will query our own series builder facade to retrive the correct
        //data point object, which will contain the metadata
        Pellion.Notebook.Plotting.DataPoint dp = vmodel.GetDataPoint(si.SeriesName, si.DataSeriesIndex);
        return dp.Metadata; //that was easy!
    }

    public object ConvertBack(object value, Type targetType, object parameter, System.Globalization.CultureInfo culture) { throw new NotImplementedException(); }
}
- dsantimore answered 10 years ago
- last edited 10 years ago
- You must login to post comments
Hi there,
Hmmm its an interesting question, one that’s been asked a few times before. We toyed with the idea of creating a Metadata per-point in the XyDataSeries, but this would be potentially very slow (also increasing memory requirements a lot), so we left it out.
Typically what our users do is they do a fast-lookup on mouse-down (e.g. result of a hit-test) on the X-Value to get the index of the point hit. We expose a method DataSeries.FindIndex which can return the index of an X-value using a quick-search algorithm.
        /// <summary>
        /// Finds the index to the DataSeries at the specified X-Value
        /// </summary>
        /// <param name="x">The X-value to search for</param>
        /// <param name="searchMode">The <see cref="SearchMode"/> options to use. Default is exact, where -1 is returned if the index is not found</param>
        /// <returns>The index of the found value</returns>
        int FindIndex(IComparable x, SearchMode searchMode = SearchMode.Exact);
What is it you wanted to do? I assume something like show a tooltip on click or hover of a point?
Best regards,
Andrew
- Andrew Burnett-Thompson answered 10 years ago
 Hi Andrew, Yes, the essence of what I want to do is a hover tooltip. The mechanics of that are not the issue; the issue is that the metadata may be indexed by something other than the X-value. For example, in electrical capacity, you might plot Voltage (Y) vs Capacity (X), but have no time value. Yet you might be interested in knowing a time-derived value at any given data point. I understand why this would be slow; I wonder what the overhead is for me to implement my own series (which I assume would be the only other alternative).
 So I think I will attempt to profile the solution you've suggested: I will maintain my own SortedList, which is about as memory efficient as it will get without being built into a series. I took at look at the implementation of my own DataSeries, but without the source, I think I'd be doing a hacky sort of job. Dan.
- You must login to post comments
Please login first to submit.

