Trade Buy Sell AnnotationsMulti-Axis and Programmatic RangingTemplated Point Markers
With the SciChart release barely behind us, the team has sketched out a list of features and fixes for v1.2.0, which is slated for a 6th April 2012 release.
The following features have already been implemented in the our WPF Chart codebase and will be included in the next release:
Added ControlTemplate PointMarker property on Line, Mountain, Scatter series, which renders an optional UIElement datapoint over the series datapoints, whilst maintaining high performance.
Add ScatterSeries which renders a Xaml-specified ControlTemplate to render per datapoint, whist maintaining performance.
Added ControlTemplate RolloverMarker property to all series, to customise the UIElement rendered by the RolloverModifier as the user moves the mouse.
ModifierGroup now supports creation and population in Xaml as well as code-behind.
XZoom: RubberBandXyZoomModifier now has an IsXAxisOnly property. When true, zooms in the X-direction (horizontal) only.
RenderableSeries can now be styled properly in Xaml as creation has been moved out of the code-behind
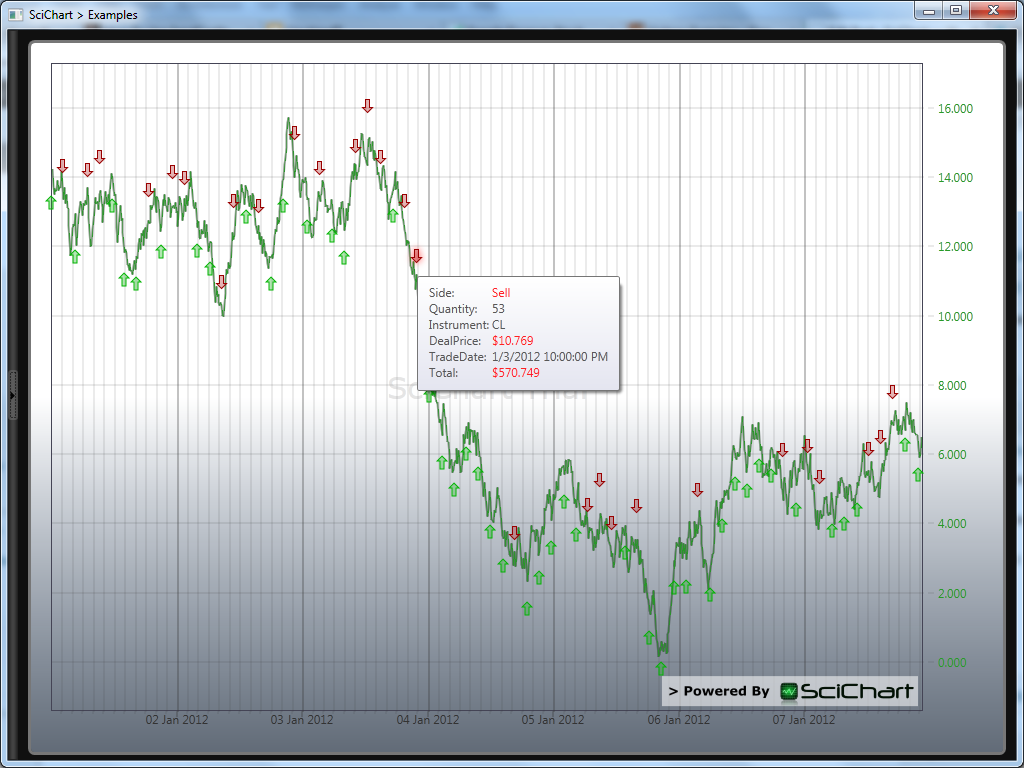
ChartModifier API extended to support basic annotations. Example created to show Xaml templated trade overlays (Buy/Sell markers) on a price series
MVVM Support. Following feedback from users SciChart has been refactored to better support MVVM, whilst maintaining performance of >1,000,000 datapoints. Changes include:
The ‘This’ Property on SciChartSurface has been deprecated. Instead bind SciChartSurface.DataSet (in Xaml) to a IDataSeriesSet instance in your ViewModel.
SciChartSurface.ZoomExtentsCommand exposed for binding a button to zoom extents.
SciChartSurface.ChartModifier can now databind to an exposed IChartModifier in your viewmodel as well as being populated in code-behind
IDataSeries.RenderAs has been depreciated. Instead populate the SciChartSurface.RenderableSeries property in Xaml.
MVVM Examples (SciTrader, Oscilloscope, EEG) updated throughout to demonstrate how to use the new API.
Fixed an innaccuracy bug in RenderableSeries.HitTest, which is used by RolloverModifier to inspect values
Fixed stuck X-Axis drag and pan when zoomed in on the SciTrader example
Added Point Markers example, uses custom ControlTemplate for point markers and shows how to inspect datapoint values with the RolloverModifier
Fixed EEG Example freezing in Silverlight (Binding issue)
Fixed Programmatic setting of VisibleRange & AutoRange properties not being listened to in some circumstances
Several examples now use the RubberBandXyZoomModifier.IsXAxisOnly property for zooming
Hopefully there’s a lot more to come. Between now and end of April we intend to add the following features and fixes:
Setting of Tick Label frequency on X and Y Axes
When user resizes the desired number of ticks should change
XAxis Tick Generation when type is DateTime is buggy on resize / pan
Add ControlTemplate tooltip support to RolloverModifier / HitTest
Add true Linked Chart support, shared XAxis and multiple Y axis, sharing of modifiers
Refactor to allow better Xaml styling of Axes in multi-axis scenarios
Various rendering improvements & fixes
If you have a specific requirement or feature request, please feel free to contact us. It is on the basis of your feedback that we aim to build a quality high performance charting product.
Queens Award for Innovation Proud winners of the Queens Award for Innovation, 2019. Awarded on account of our innovative graphics engine which underpins the SciChart library and enables our world-beating charting performance
National Business Awards Highly Commended for Lloyds National Business Awards, 2019. Awarded on account of our innovative graphics engine and impressive customer base
Reviews SciChart has received hundreds of verified, 3rd party reviews
Try SciChart Today
Start a trial and discover why we are the choice of demanding developers worldwide
We use cookies to give you the best experience on our website. Cookies are files stored in your browser and are used by most websites to help personalise your web experience. By continuing to use our website, you are agreeing to our use of cookies.