What’s new in Quarter 2


With the SciChart release barely behind us, the team has sketched out a list of features and fixes for v1.2.0, which is slated for a 6th April 2012 release.
The following features have already been implemented in the our WPF Chart codebase and will be included in the next release:
- Added ControlTemplate PointMarker property on Line, Mountain, Scatter series, which renders an optional UIElement datapoint over the series datapoints, whilst maintaining high performance.
- Add ScatterSeries which renders a Xaml-specified ControlTemplate to render per datapoint, whist maintaining performance.
- Added ControlTemplate RolloverMarker property to all series, to customise the UIElement rendered by the RolloverModifier as the user moves the mouse.
- ModifierGroup now supports creation and population in Xaml as well as code-behind.
- XZoom: RubberBandXyZoomModifier now has an IsXAxisOnly property. When true, zooms in the X-direction (horizontal) only.
- RenderableSeries can now be styled properly in Xaml as creation has been moved out of the code-behind
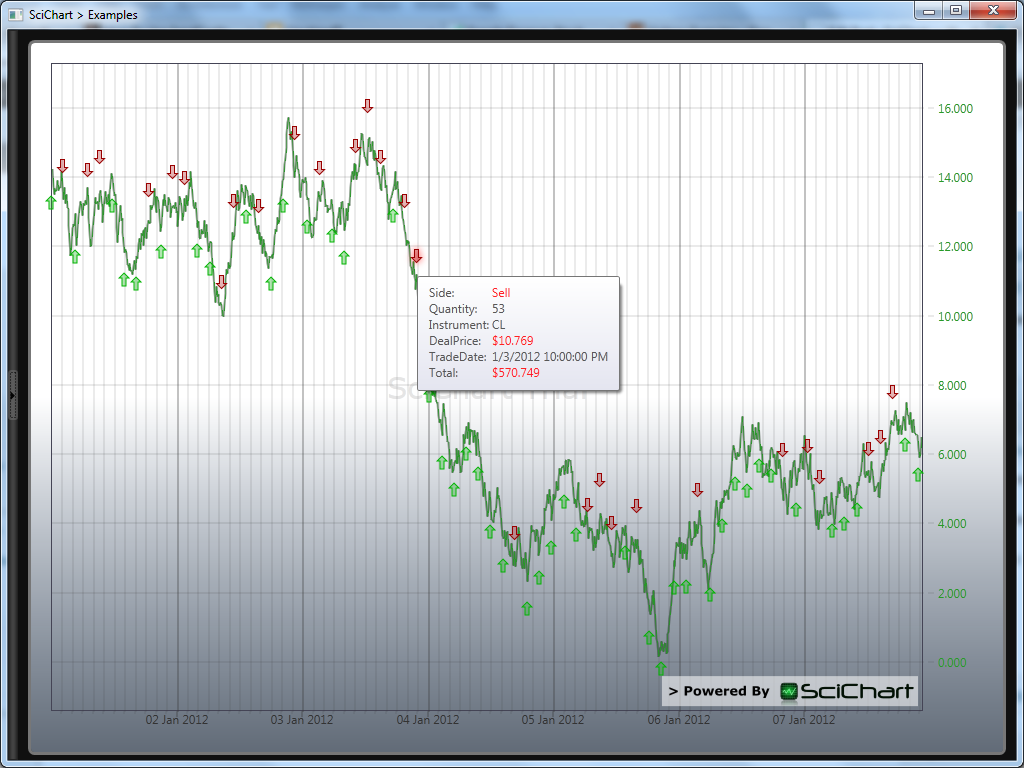
- ChartModifier API extended to support basic annotations. Example created to show Xaml templated trade overlays (Buy/Sell markers) on a price series
- MVVM Support. Following feedback from users SciChart has been refactored to better support MVVM, whilst maintaining performance of >1,000,000 datapoints. Changes include:
- The ‘This’ Property on SciChartSurface has been deprecated. Instead bind SciChartSurface.DataSet (in Xaml) to a IDataSeriesSet instance in your ViewModel.
- SciChartSurface.ZoomExtentsCommand exposed for binding a button to zoom extents.
- SciChartSurface.ChartModifier can now databind to an exposed IChartModifier in your viewmodel as well as being populated in code-behind
- IDataSeries.RenderAs has been depreciated. Instead populate the SciChartSurface.RenderableSeries property in Xaml.
- MVVM Examples (SciTrader, Oscilloscope, EEG) updated throughout to demonstrate how to use the new API.
- Fixed an innaccuracy bug in RenderableSeries.HitTest, which is used by RolloverModifier to inspect values
- Fixed stuck X-Axis drag and pan when zoomed in on the SciTrader example
- Added Point Markers example, uses custom ControlTemplate for point markers and shows how to inspect datapoint values with the RolloverModifier
- Fixed EEG Example freezing in Silverlight (Binding issue)
- Fixed Programmatic setting of VisibleRange & AutoRange properties not being listened to in some circumstances
- Several examples now use the RubberBandXyZoomModifier.IsXAxisOnly property for zooming
Hopefully there’s a lot more to come. Between now and end of April we intend to add the following features and fixes:
- Setting of Tick Label frequency on X and Y Axes
- When user resizes the desired number of ticks should change
- XAxis Tick Generation when type is DateTime is buggy on resize / pan
- Add ControlTemplate tooltip support to RolloverModifier / HitTest
- Add true Linked Chart support, shared XAxis and multiple Y axis, sharing of modifiers
- Refactor to allow better Xaml styling of Axes in multi-axis scenarios
- Various rendering improvements & fixes
If you have a specific requirement or feature request, please feel free to contact us. It is on the basis of your feedback that we aim to build a quality high performance charting product.
Related Posts
