Pre loader
Try wave

Android Stock Chart Library

SciChart Android is a High Performance, Real-time Chart Library for Android developers. If you need a Fast, Powerful, Feature-rich and Interactive Android Stock Chart in your Java or Kotlin or Xamarin App then look no further than SciChart Android.

Download Free Trial View Chart Pricing

Banner Image

Android Stock Chart Features

Our Android Charts are flexible and feature rich, with rich touch pan and zoom interactivity for use in trading applications on the mobile phone and tablet, whether you are working with Java, Kotlin or Xamarin. SciChart Android supports a number of chart types out of the box, among those are: Candlestick, OHLC, Mountain/AreaColumnLineScatter charts. The value is added with abilty to synchronize multiple charts, overlay buy/sell annotations, display price values on the Y-Axis, and add your own custom indicators as our charts support multiple series of different types on the same chart surface. You can override the color of any column or candle with our PaletteProvider API, you can add optional tooltips and legends and even customizing rendering by making your own custom chart series.

quote
star
star
star
star
star
Why build trading applications for iPad/iPhone? Fidelity Investments, which has nearly 15 million retail brokerage customer accounts, says that in 2013, mobile trading, including trading from tablets, grew 63% over the previous year. according to marketwatch.com*

Marketwatch.com

Need performance in your trading application?

By working alongside seasoned traders, we aim to bring you a truly high-performance, interactive experience for your trading applications on any Android device. We acknowledge that hundreds of data points may be sent every minute and that is when performance is critical and will have dramatic impact on profitability in a trading applcation. SciChart Android is shown to perform the best in a real-time context. Our stock charts really shine, because we understand that you want your users to be able to concentrate on trading, and not worry about hangs or performance issues in the charting software. Good performance is supported with interactivity, friendly panning and zooming. Our Android Stock Charts are fast to start up, fast at drawing and at updates. In conducted Performance Tests SciChart Android is up to 225x faster than the nearest competitor and is consistently faster and smoother in real-time trading applications than other Android Chart Components. See some brief results of comparison performed in the table below.

Need more customization?

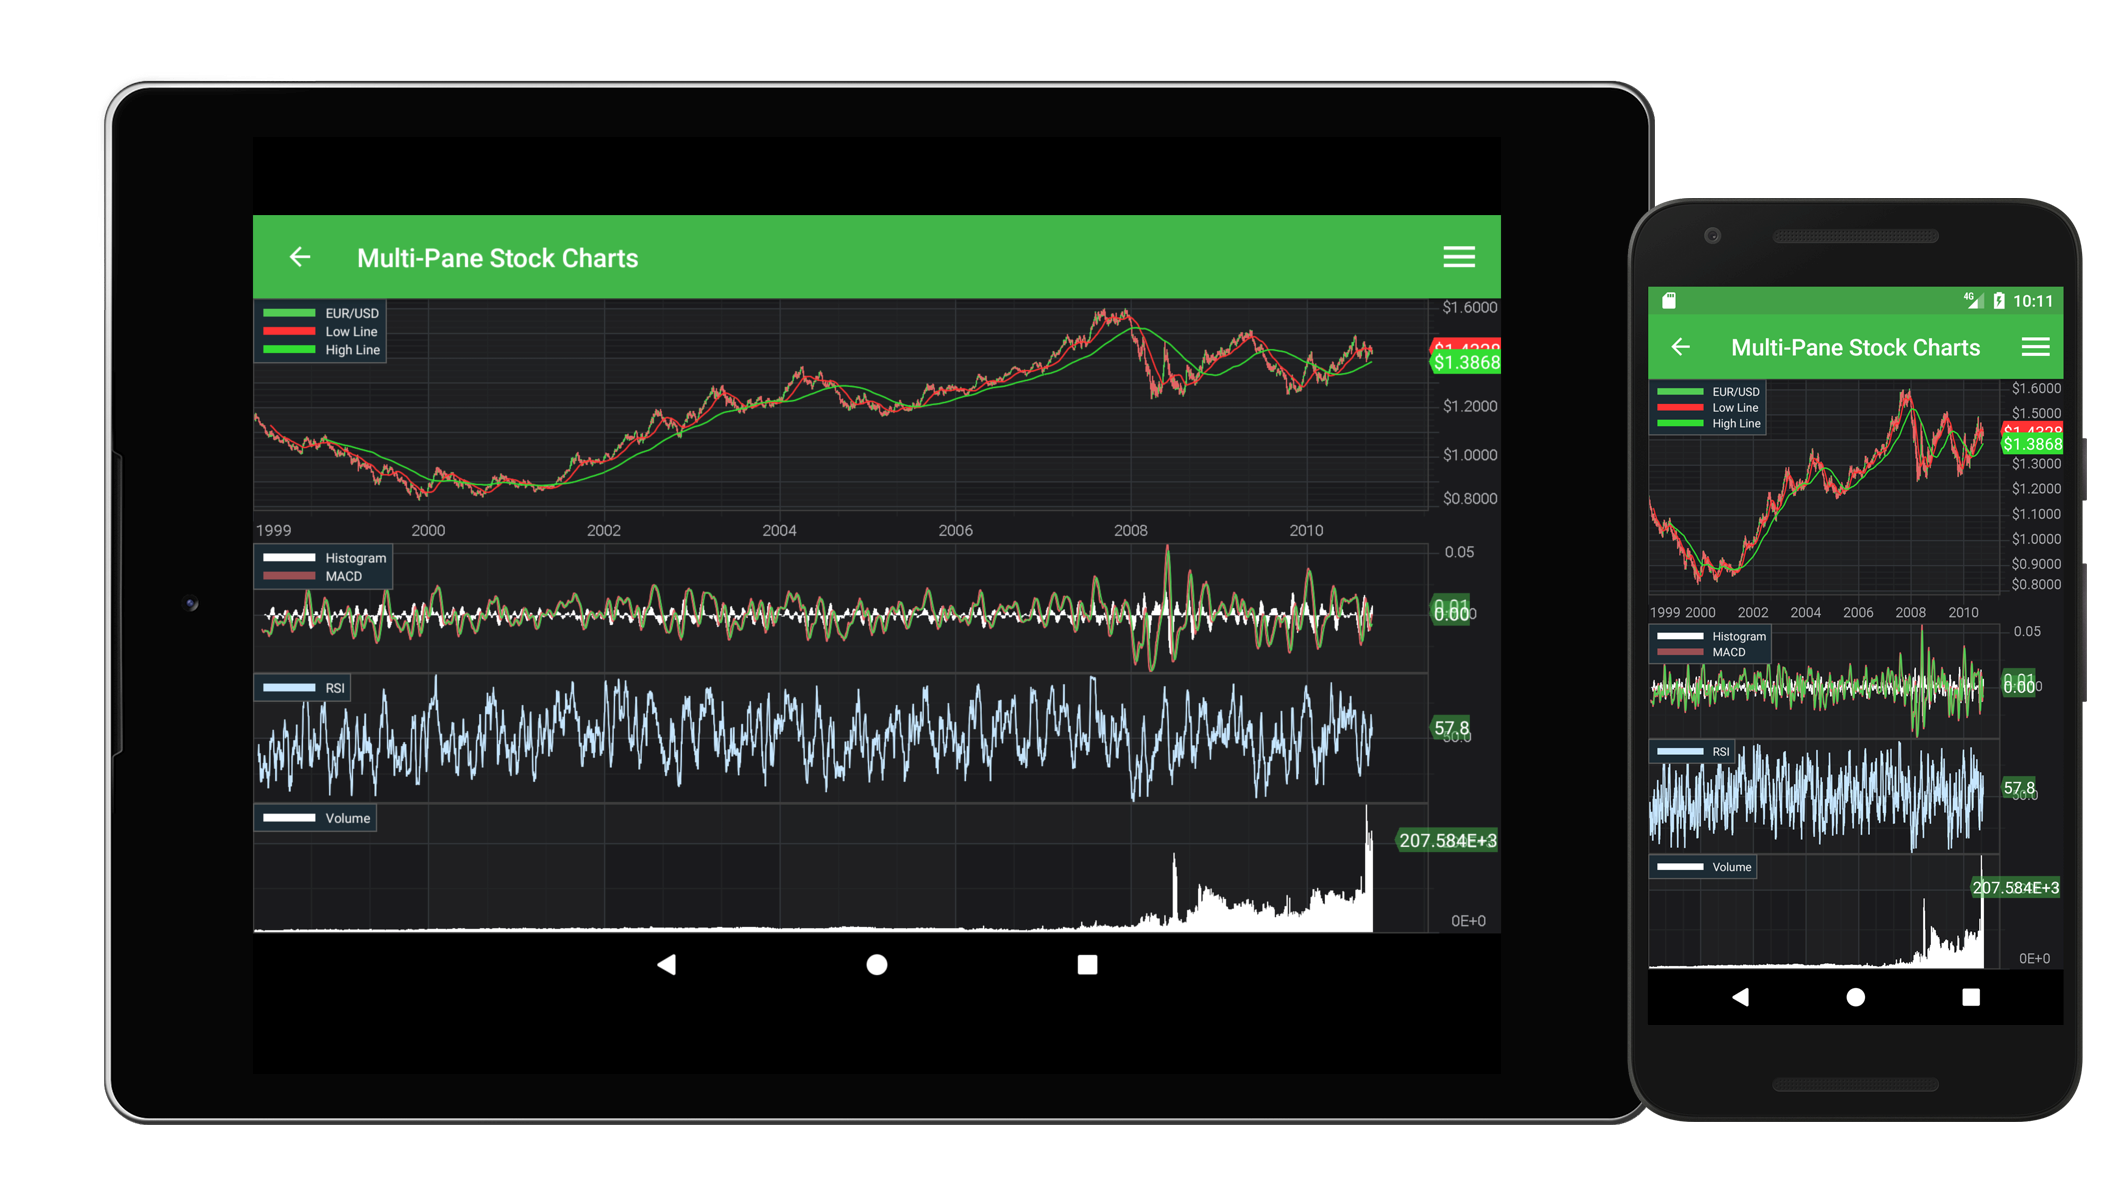
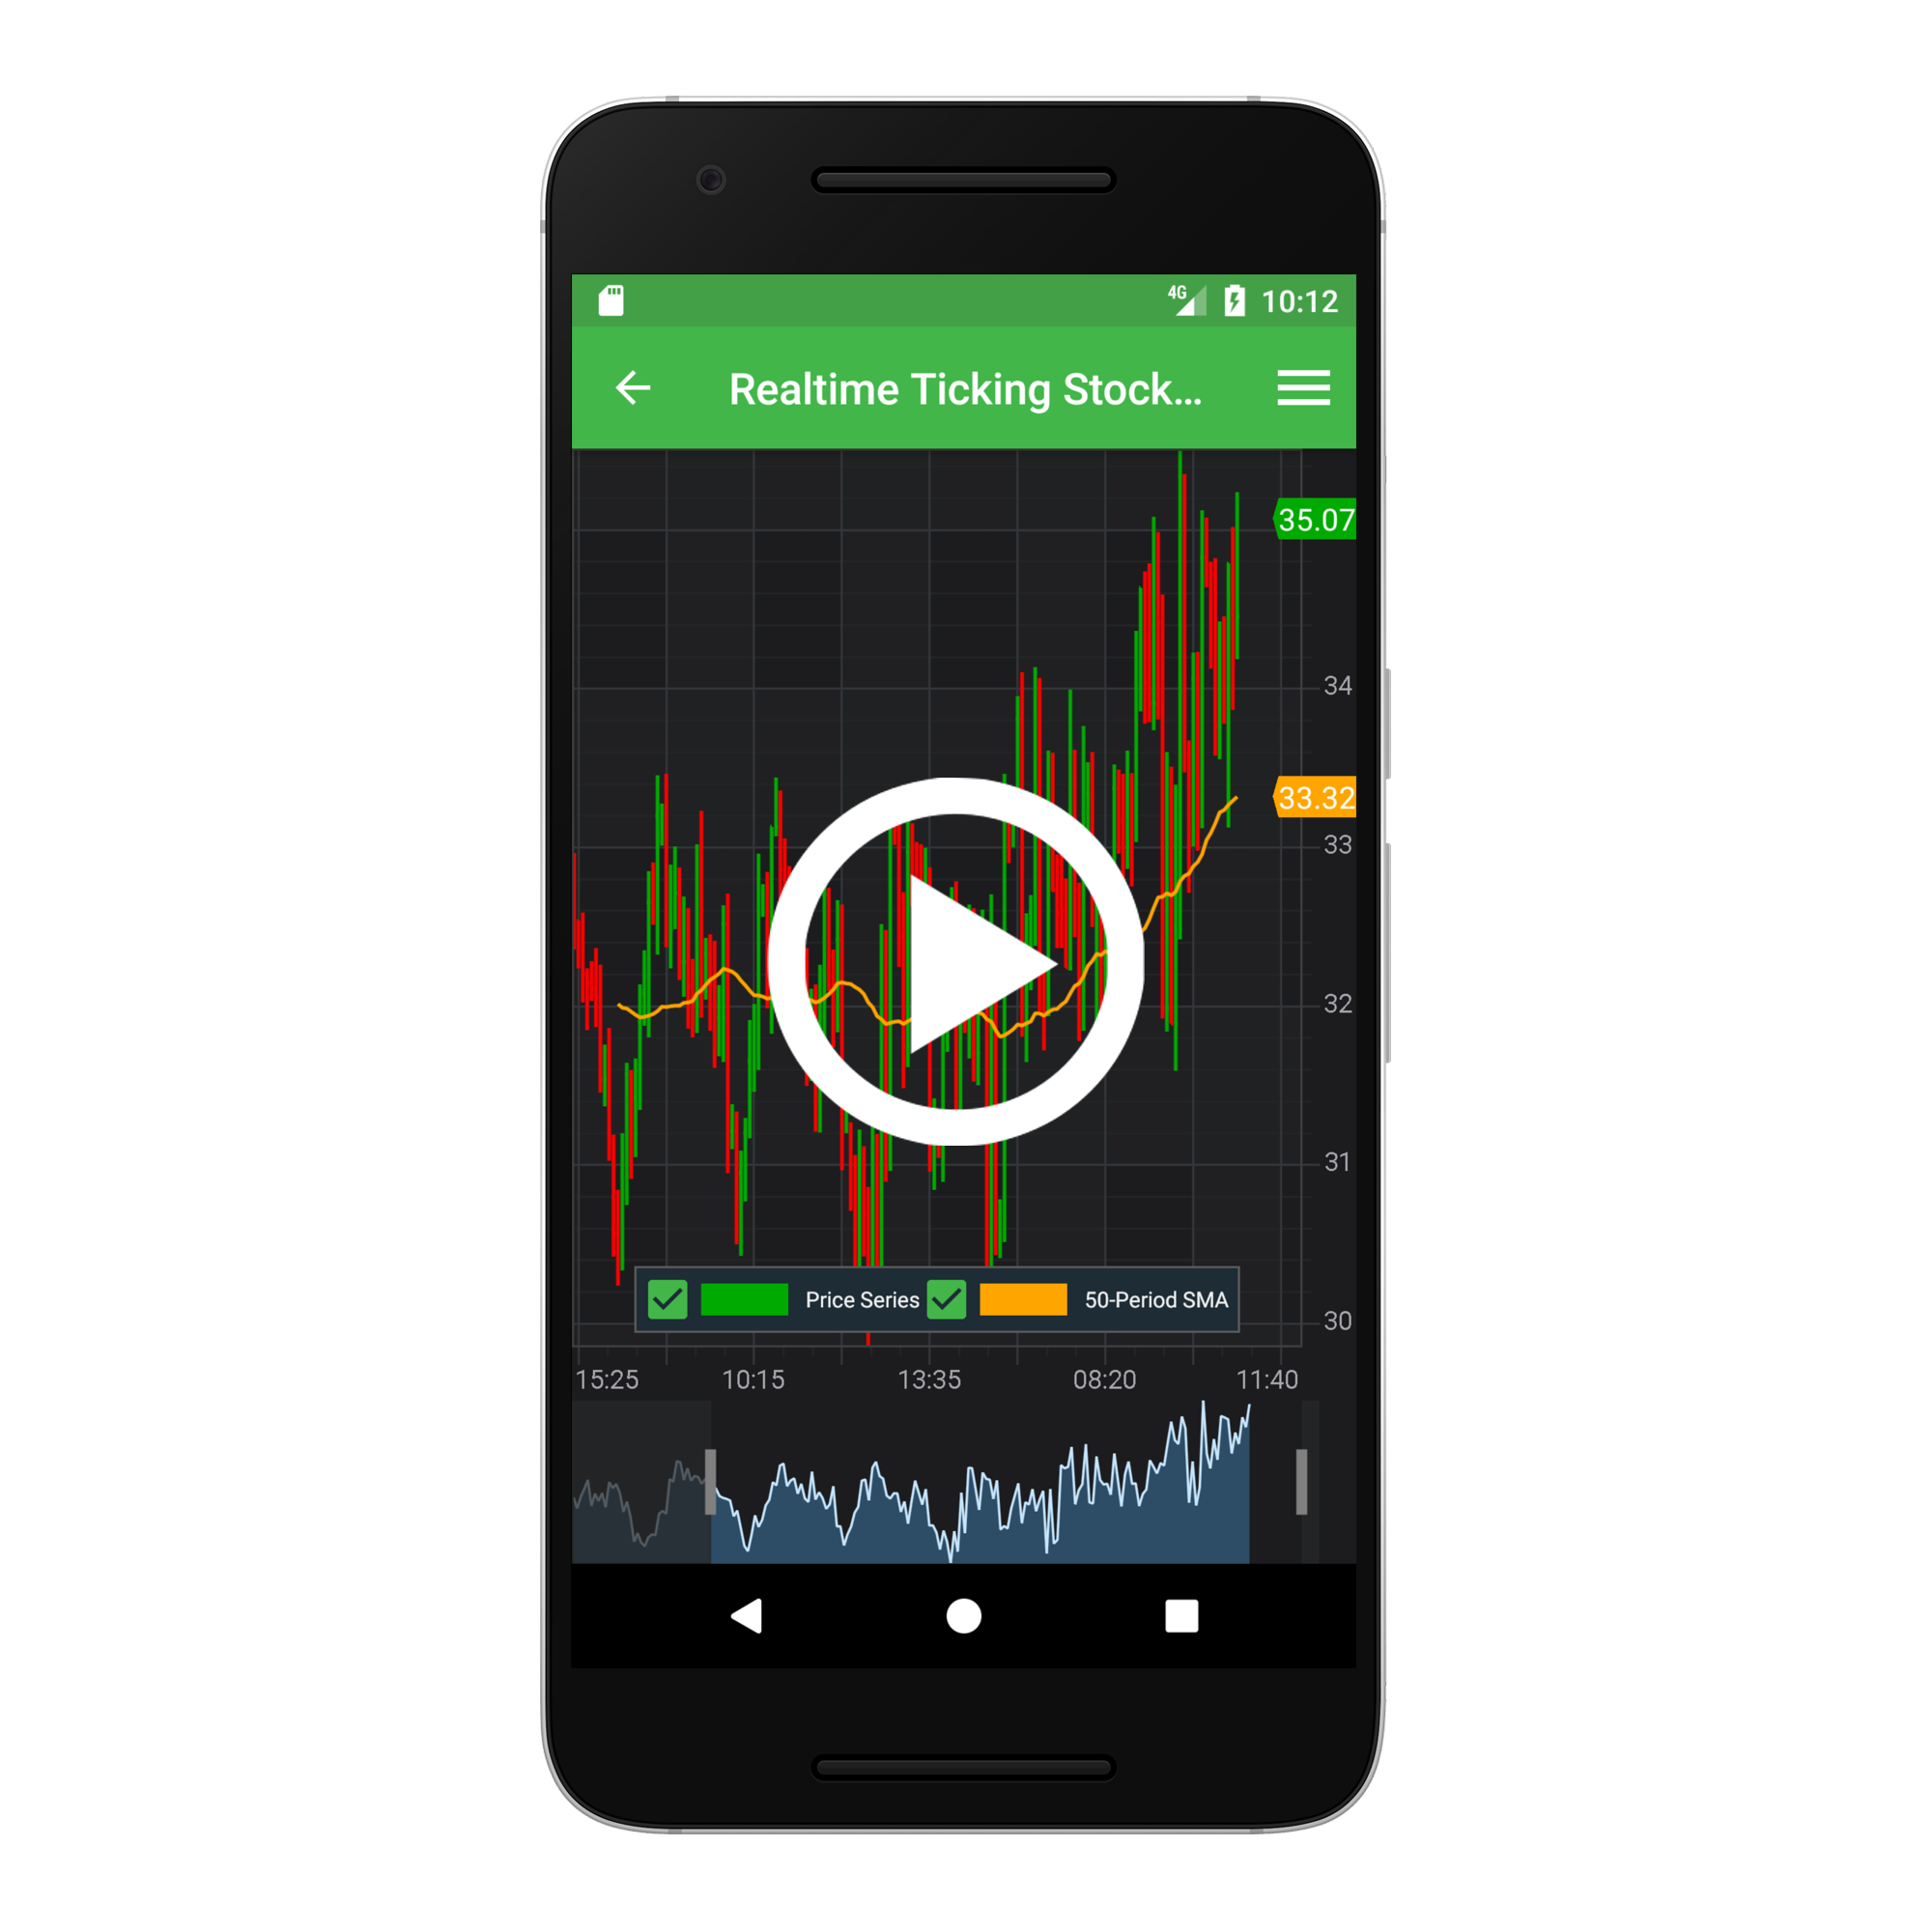
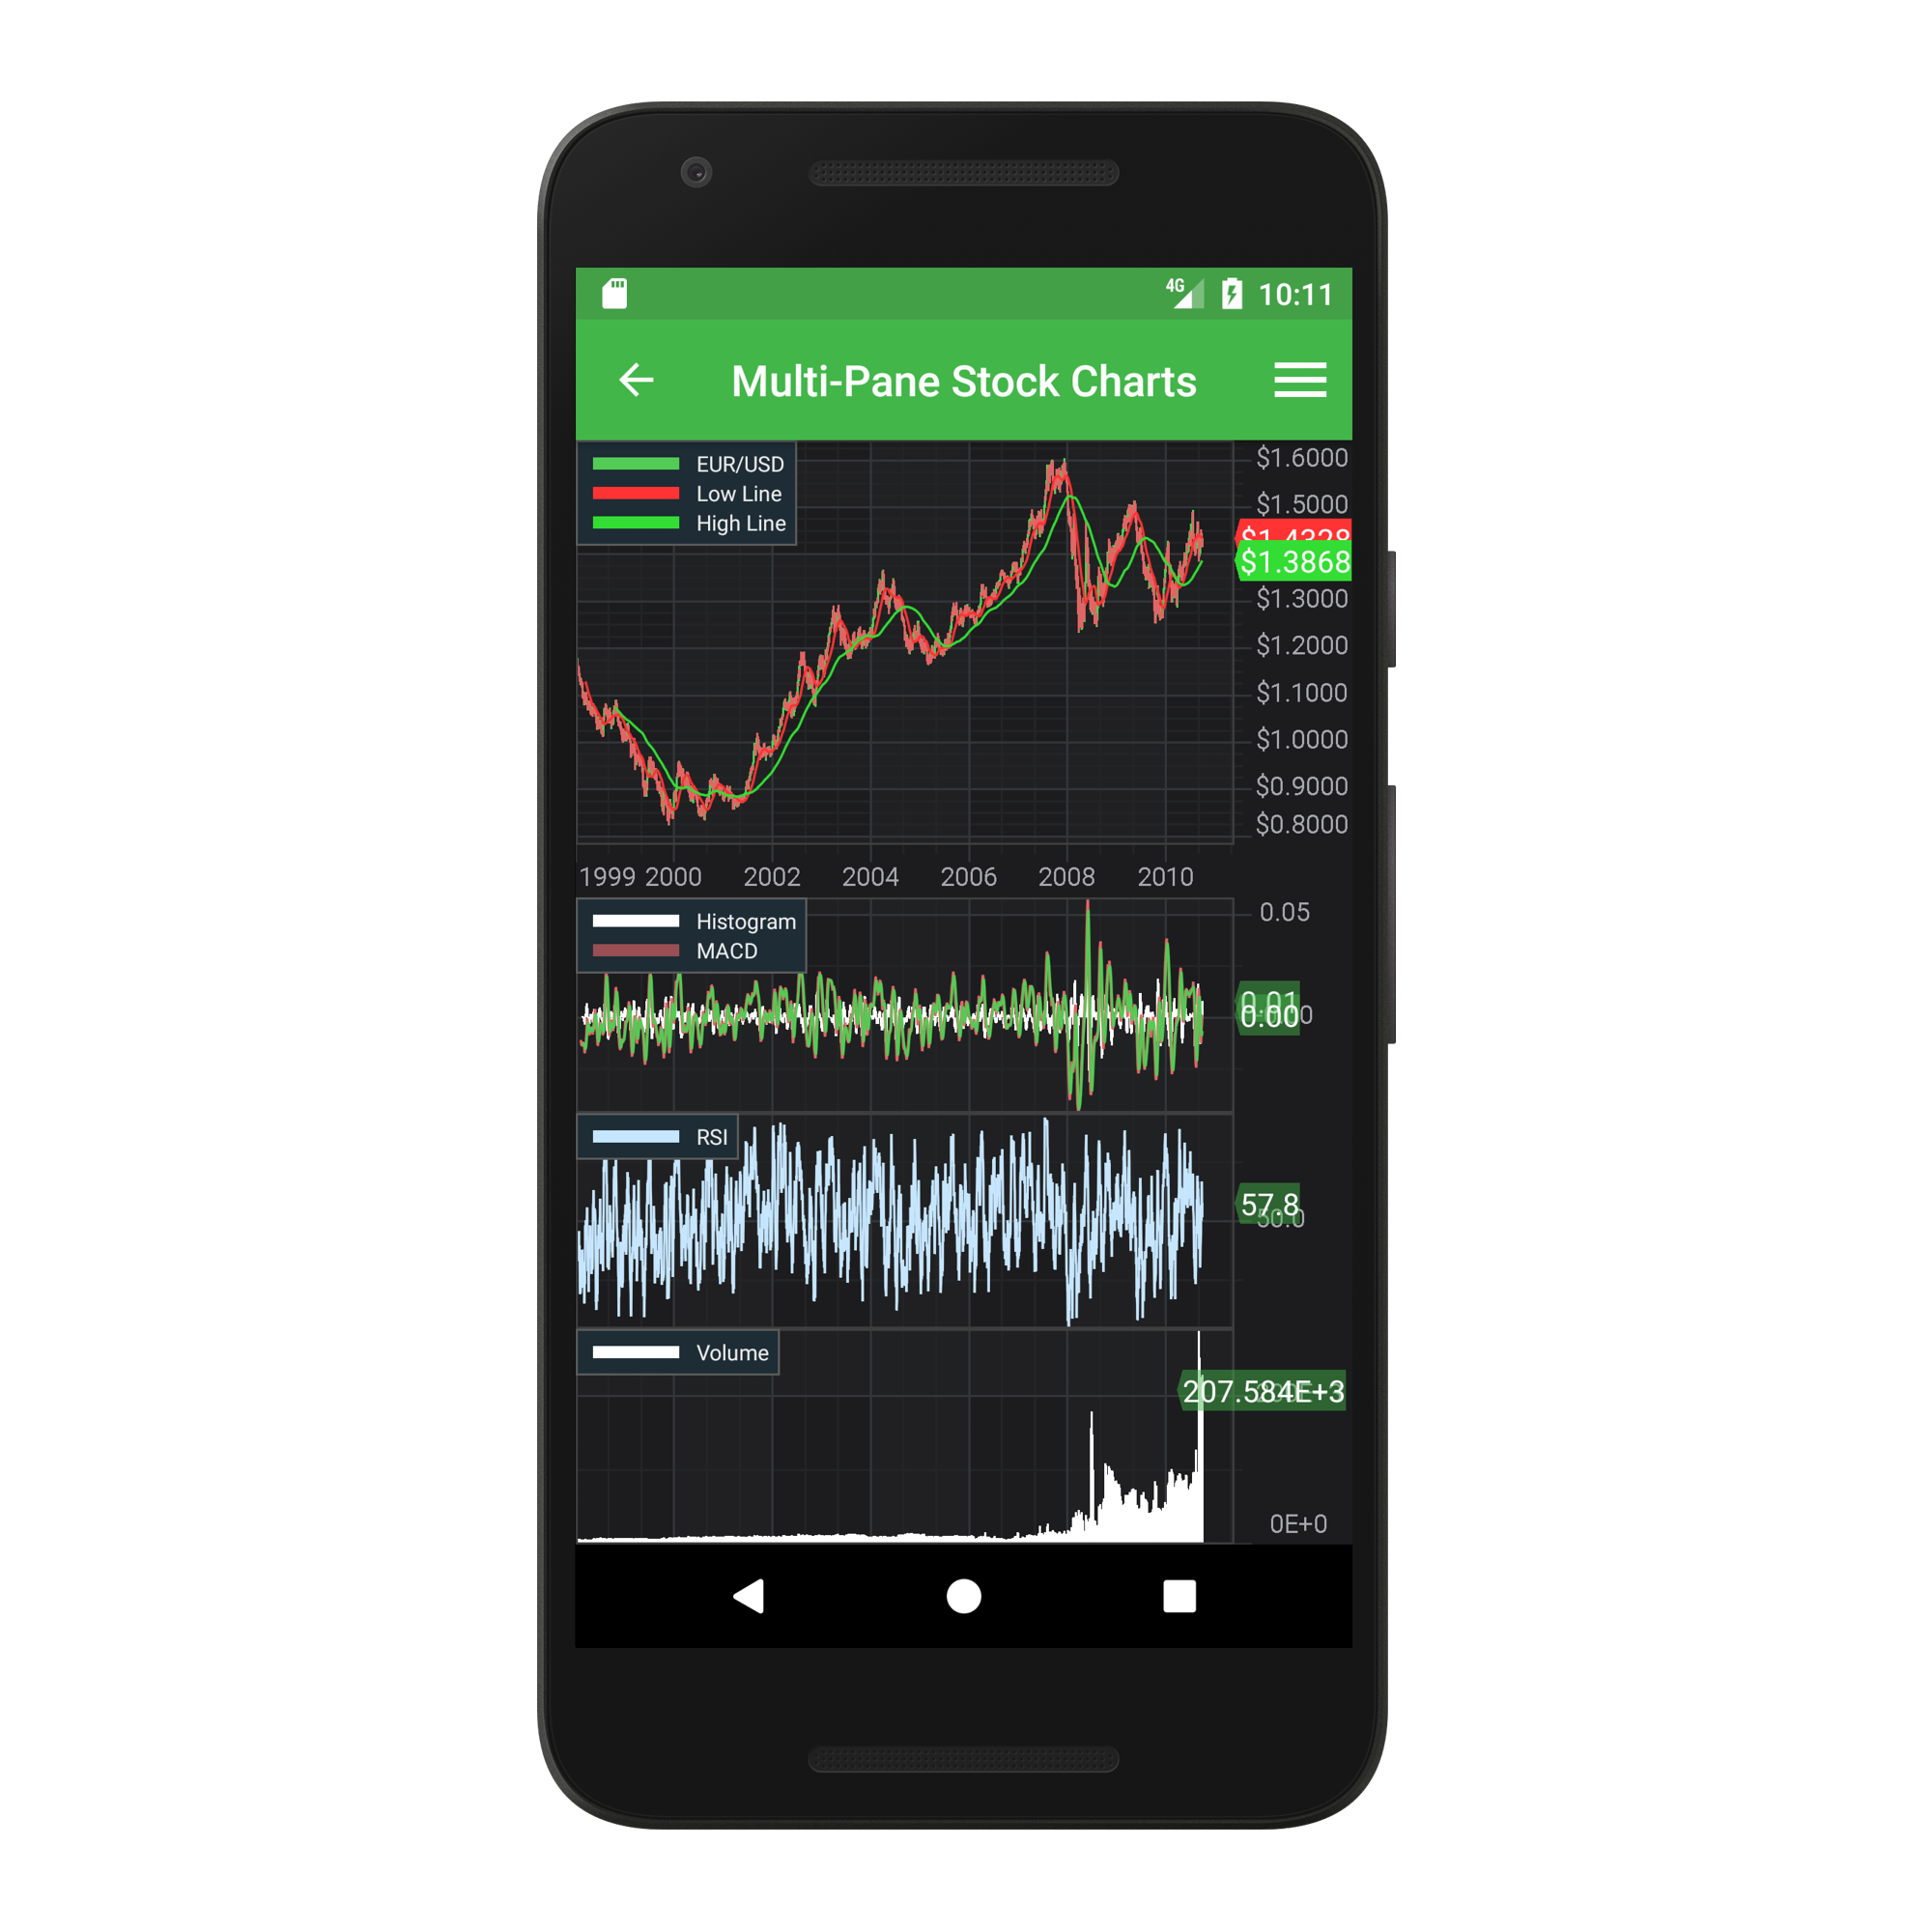
Our Android and Xamarin Android Stock Charts enable you to create true Realtime, Multi-pane Stock Chart applications. With SciChart you can add or remove panes, with different chart types. indicator & volume panes, all of which update and synchronize as you change your data. SciChart supports annotations which may be overlaid on the chart, including Text, Line, Box, HorizontalLine, VerticalLine out of the box, as well as our CustomAnnotation type which allows you to draw any UIView over the chart at a predefined location. Charts are enriched with intuitive pan, zoom and tapping functionality for working with the data in efficient way.

quote
star
star
star
star
star
Believe us, we implemented the charts our own in our software, we wouldn’t do it again… Have you considered: Resampling if you have more data than pixels? Autoscaling (and configure autoscale to scale within defined limits so that you don’t just show noise)? Interaction with the chart via touch gestures? Performance? Including real-time updates on low-end hardware? Reusing the charts on other projects? Believe me, just use SciChart and it just works! Micheal Guntli, user of SciChart Android from IMT

User from MIT

All this starting from $549 / Developer License

SciChart’s Android Stock Charts are a part of SciChart Android package. SciChart Charts are licensed on a perpetual, per-developer licensing model, with royalty free redistribution. You get access to the world’s fastest Android Charts, starting from just $549 per developer license.

Buy Now

Building your Stock Chart Mobile App Developer FAQ

icon

Do you have Stock Charts for iOS and Xamarin Android?

Yes and yes! Please see our iOS Stock Charts Page and Xamarin bindings page. With SciChart Xamarin you will be able to share the logic not only through iOS and Android but WPF as well. Please take a look at the Xamaring examples as well.

icon

How do I add series to my chart?

We have a simple, easy to follow tutorial showing how to add two chart series and some data to a SciChart Android Chart. Simply declare a RenderableSeries, and a DataSeries, and append some data, and SciChart does the rest!

icon

How do I insert price data into my trading application?

Once you have declared a RenderableSeries and a DataSeries as per our tutorial above, simply update the data, and the chart will update too.

icon

How do I add panes?

To create multi-pane stock charts, you simply declare multiple SciChartSurfaces in your application and link them together. We have an example showing how to synchronize two charts We also have a great code example which shows how to create a multi-pane stock chart.

icon

How do I configure zoom and pan behavior?

SciChart allows you to configure zoom and pan interactions via the ChartModifier API. If you want to add Pinch to Zoom, Drag an Axis to Zoom, or double-tap to zoom extents, just use one of our built-in modifiers. Or, if you need a custom interaction, you can even create custom ChartModifiers. To find out how to use them, please see our Tutorial on adding Zooming, Panning behavior There is also documentation for PinchZoom and ZoomPan modifiers 

icon

How do I use annotations to create buy/sell indicators?

SciChart features a rich, customizable Annotation API which allows you to place text, lines, and custom markers on the chart. You can find out how to use our Annotations API with our Tutorial – Adding Annotations.

icon

How do I add realtime data to my chart?

SciChart excels at realtime chart performance which is absolutely necessary for your Android Trading applications. You can view our code example on Realtime ticking stock charts . This shows how to tick and update a Candlestick or OHLC chart in realtime.

icon

How do I add a Tooltip to the chart?

You guessed it:) we even have a tutorial and a code example for adding tooltips to the chart via our flexible tooltipslegends and rollover modifier documentation.

icon

GREAT! HOW DO I BUY IT!?

Go to our store or contact sales ! We will be happy to assist.

Try SciChart Today

Start a trial and discover why we are the choice
of demanding developers worldwide

Start TrialCase Studies