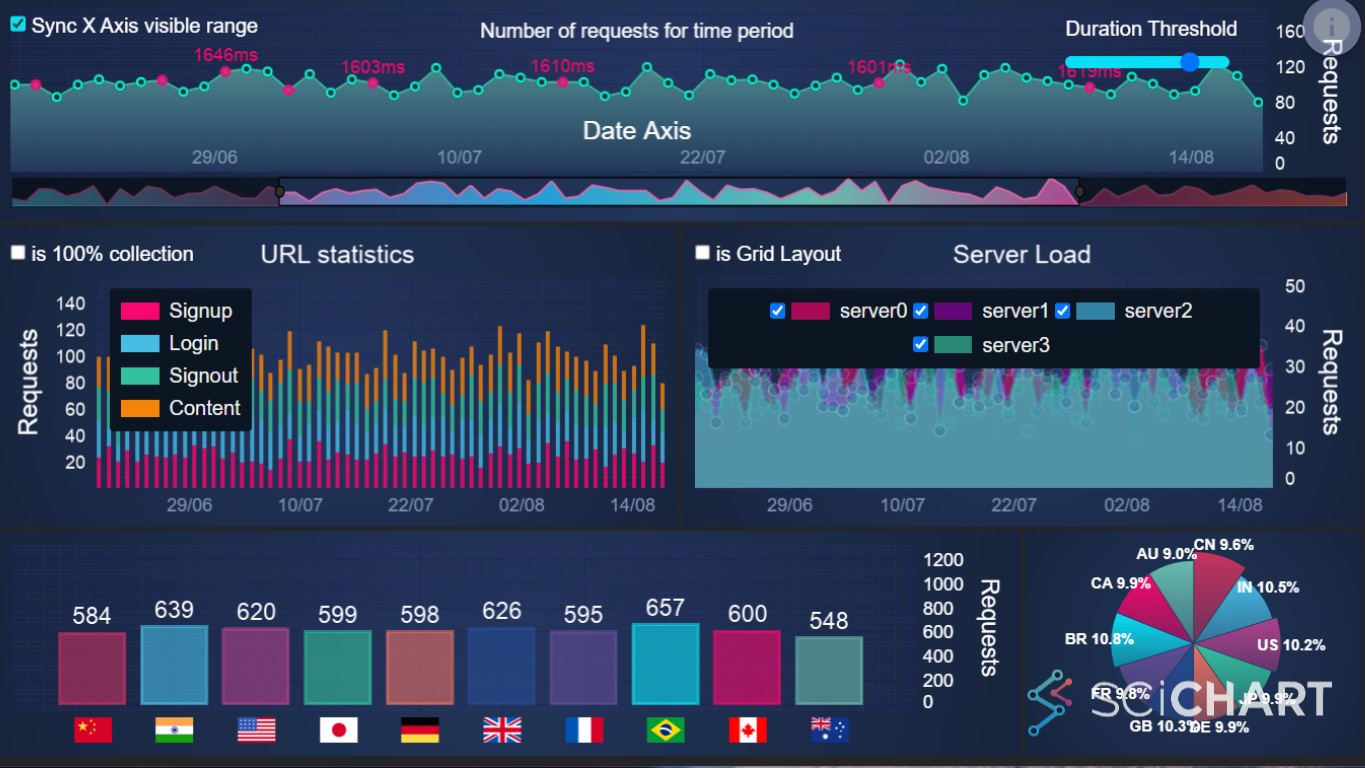
In this series we compare JavaScript Chart Libraries. There are a wide range of libraries and frameworks for creating charts and graphs in React, JavaScript, Angular or Vue. This can lead to confusion when selecting the best chart library for your needs! Our detailed guides offer comparative insights into the best JavaScript Chart options, assisting you in finding the right fit for your application’s requirements.
In this post we’re looking at ApexCharts. We’re going to discuss what is ApexCharts, what are the pros & cons, how to improve ApexCharts performance for dashboards and finally alternatives to ApexCharts for enterprise software applications.
What is ApexCharts?
ApexCharts is a modern charting library that helps developers to create beautiful and interactive visualisations for web applications. It’s an open-source tool that offers a rich set of features and is easy to implement. With ApexCharts, you can create various types of charts such as line, bar, area, donut, pie, and more.
ApexCharts stands out for its clean, modern UI style allowing you to create great looking responsive charts and dashboards. It’s feature rich with smooth animations, interactions and annotations available out of the box.
What are the Pros and Cons of ApexCharts?
Pros of ApexCharts
One thing about ApexCharts, they sure are beautiful. For creating a light KPI dashboard with very few datapoints, this is a great choice. Pros (plus points) of the library can be found below:
- Provides responsive, visually appealing animated charts & dashboards with a clean look & feel
- Lightweight core library: 501kb minified and 131kb Gzipped according to Bundlephobia
- Has 16 chart types including Line, Area, Column, Candlestick, Box-plot, Bubble, Scatter, Funnel, Timeline, Heatmap, Treemap, Pie/Donut, Radar and Polar Area
- Free open source JavaScript chart library, with a permissive MIT License
- High quality demos covering JavaScript, React, Vue and Angular
- Good documentation for an open source library
- Has a number of pre-canned dashboard templates for rapid implementation
- Powerful out-of-the-box feature set including interactive zooming, panning, annotations, data-labels
- Actively maintained open source library with a good number of contributors and stackoverflow questions
Cons (Drawbacks) of ApexCharts
Every JavaScript chart library comes with its drawbacks. A list of the cons that we saw with ApexCharts can be found below:
- Seems to be more focussed on creating KPI dashboards and quick visualisations, and may not be suitable for more demanding or complex enterprise apps
- No support for 3D Charts
- Supports category, datetime and numeric axis but no logarithmic axis
- Using SVG (Scalable Vector Graphics) for rendering results in high quality, but limits the number of data-points to maximum of a few thousand before significant slowdown
- Google searches reveal ApexCharts suffers from performance problems. For example, some Github Issues and stack overflow posts report:
- Github Issue 208: ApexCharts is too slow when updating only 1,000 points
- Github Issue 44: Rendering performance for large dataset is too slow
- StackOverflow: ApexCharts Performance Problems
- Not suitable for realtime updates beyond a small number of data-points or low rate of change, with performance problems reporting here also
- Open source means lack of enterprise technical support
How to Improve ApexCharts Performance?
ApexCharts is designed for good-looking dashboards, and is probably not suitable for applications that require demanding performance.
Nevertheless, recommendations from the ApexCharts community give the following ways to boost performance:
- Animation
chart.animations.enabled = false- Markers size set to 0
markers.size = 0- Disable DataLabels
dataLabels.enabled = false
This will only get you so far however, with SVG rendering you will still be limited to small datasets and infrequent dynamic (realtime) updates.
What are the alternatives to ApexCharts?
For applications which have demanding requirements, complex dashboards or big-data / performance requirements one viable alternative is SciChart.js.
One of the differences about SciChart.js is it’s designed for demanding applications that require custom features, high performance, or complex visualisations & interactions. It’s particularly focussed on enterprises building mission-critical apps, citing scientific, medical users like Siemens, financial users such as JP Morgan & aerospace such as Nasa as key customers.
SciChart.js is designed for the following types of application:
- Enterprise apps which expect high-performance or big-data handling
- Complex interactions, zooming, panning, linking of charts, tooltips and annotations available out of the box
- SaaS apps, enterprise apps or Electron (desktop) apps
- Enterprise apps which find tech-support a value-add
With support for React, Vue, Angular, enterprise tech-support and a wide set of docs, examples and demos, SciChart.js can quickly pay back the investment in time / cost savings when building your applications.
What are the Advantages of SciChart.js vs. ApexCharts?
When compared to ApexCharts, SciChart.js has the following advantages:
- Very high performance for big datasets (1k, 10k, 100k, 1M, 10M+)
- Over 30 chart types including 2D & 3D charts out of the box
- Allows complex chart interactions, allowing you to create rich dashboards for real-time monitoring, server monitoring or visualizing telemetry data
- Specific focus on (but not limited to) scientific, engineering, financial as well as business and enterprise sectors
- Highly extensible API with many endpoints allowing for customisation, overriding or bespoke behaviour to fit your specific application needs.
- Very high quality, thorough documentation with embedded codepens
- Hundreds of JS and React chart demos online
- A very high user-rating with positive testimonials
- Enterprise tech support with fast bug fix turnaround and a frequent release schedule, allowing you to save time & money in your projects.
Learn more about SciChart.js
To learn more about SciChart.js or to discover its features in more detail, take a look at the page below:
Contact us to learn more
SciChart.js is a JavaScript Chart and React Chart Library designed for complex, mission critical data visualization applications. Now with a FREE community edition. If you have a question or would like to learn more about our products & services, please contact us:
Recent Blogs

