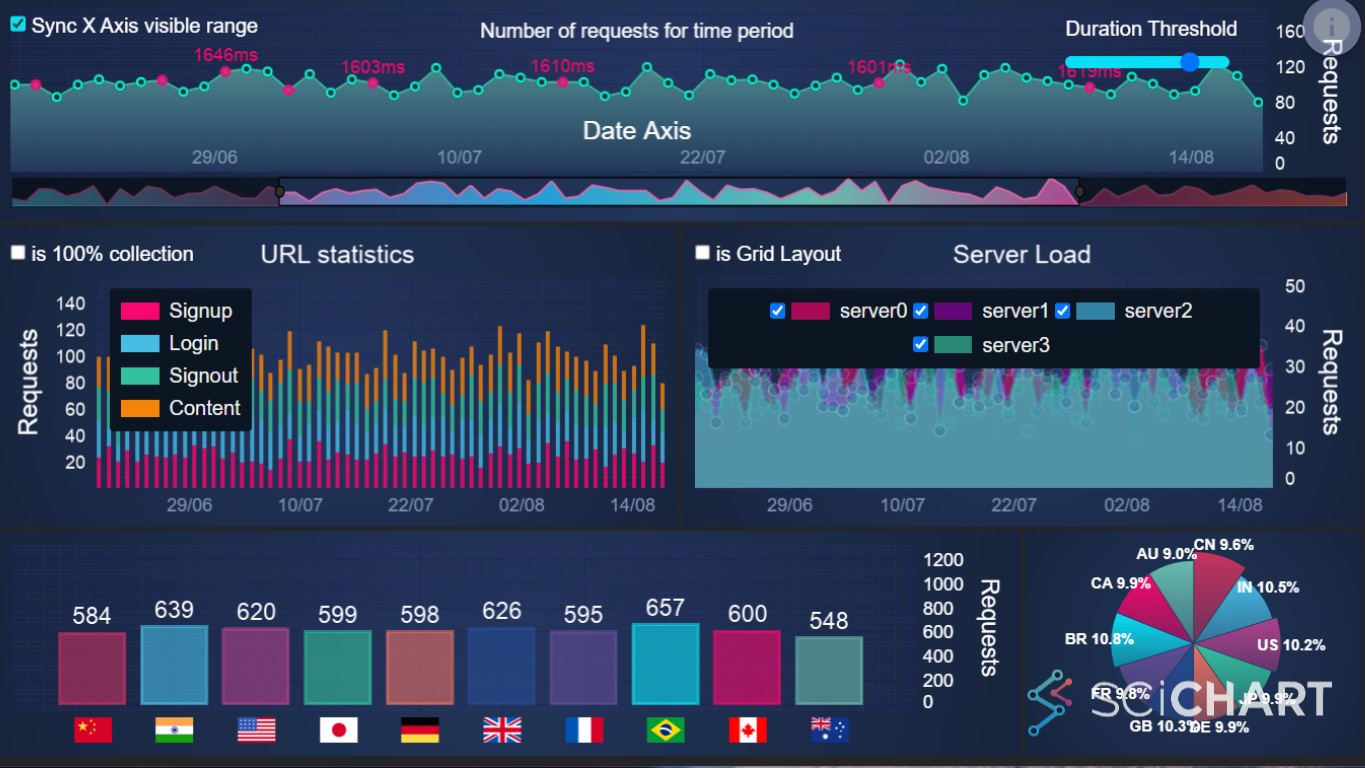
In this series we examine the diverse world of JavaScript Chart Libraries. JavaScript’s expansive ecosystem offers a rich array of frameworks, plugins, and libraries perfect for embedding charts and graphs in your applications. Selecting the ideal JavaScript chart library for your project is a critical decision that demands thorough evaluation. Our detailed guides will offer comparative insights into the leading JavaScript Chart options, assisting you in finding the perfect fit for your application’s specific needs.
In this post we’re looking at Plotly.js. We’re going to discuss what is Plotly.js, what are the pros & cons, how to improve Plotly.js performance and finally alternatives to Plotly.js for enterprise software applications.
What is Plotly.js?
Plotly.js is a free open source JavaScript chart library used for creating interactive and visually appealing graphs and charts. It is built on top of D3.js and stack.gl, two well-known JavaScript libraries used for web-based graphics and data visualization.
Plotly stands out for its wide range of chart types and the ease with which it allows users to create complex, data-driven visualizations, plus strong support for data-science in various integrations to statistical software.
What are the Pros and Cons of Plotly.js?
Pros of Plotly.js
- A fully featured 2D & 3D chart library with plenty of chart types including line, scatter, bar, pie, bubble, error bars, histograms, heatmaps, contours and more
- Powerful out of the box feature set including interactive zooming, panning and more
- Free open source JavaScript chart library, with a permissive MIT License
- 3D chart support
- WebGL support for big data (some limitations apply, see below)
- Subplots support or plots within plots.
- Perfect for data-science, with Python, Matlab, Julia and R modules built on top of plotly.js
- Actively maintained open source library with a strong community and stackoverflow presence
Cons (Drawbacks) of Plotly.js
- Relatively large bundle size of 3.5MB minified (1.1MB GZipped) according to Bundlephobia
- According to internet searches, Plotly.js is slow and struggles with performance with large datasets or many charts on page.For example, some webpages report:
- (Github issue 5927) Scattergl support slow to interact with moderate number of points
- (Github issue 5790) Performance issues with large data sets
- Community post – Really slow render at bar charts with big data sets
- Community post – Plotting taking a very long time for big-data
- Realtime or dynamic data updates are reportedly slow according to community posts
- Rapidly hits WebGL context limits, it is not currently possible to have more than 8 charts in the DOM when WebGL is enabled
- Very limited documentation making feature or API discovery difficult beyond simple examples
- Users find difficulty customising the chart
- Open source means lack of enterprise technical support
What are the alternatives to Plotly.js?
For applications which have demanding requirements, complex dashboards or big-data / performance requirements one viable alternative is SciChart.js.
One of the differences about SciChart.js is it’s designed for demanding applications that require custom features, high performance, or complex visualisations & interactions. It’s particularly focussed on enterprises building mission-critical apps, citing scientific, medical users like Siemens, financial users such as JP Morgan & aerospace such as Nasa as key customers.
What are the Advantages of SciChart.js vs. Plotly.js?
When compared to Plotly.js, SciChart.js has the following advantages:
- Very high performance for big datasets (1k, 10k, 100k, 1M, 10M+)
- Can have tens or hundreds of charts on a single page without hitting WebGL Context limits
- Highly extensible API with many endpoints allowing for customisation, overriding or bespoke behaviour to fit your specific application needs.
- Very high quality, thorough documentation with embedded codepens
- Hundreds of JS and React chart demos online
- A very high user-rating with positive testimonials
- Enterprise tech support with fast bug fix turnaround and a high release cadence, allowing you to save time & money in your projects.
Learn more about SciChart.js
To learn more about SciChart.js or to discover it’s features in more detail, take a look at the post below:
Contact us to learn more
SciChart.js is a JavaScript and React Chart Library designed for complex, mission critical data visualization applications. Now with a FREE community edition. If you have a question or would like to learn more about our products & services, please contact us:
Recent Blogs

