Building a Smith Chart in JavaScript: Inside the Rendering Pipeline
See how SciChart.js was extended to build a fully interactive Smith chart using standard APIs. This article highlights the flexibility of custom rendering and advanced interactions.
Earlier this year we blogged about enabling SciChart.js to work out of the box in sandbox environments like JSFiddle, Codepen.io and CodeSandbox.io. Take a look at the blog if you haven’t seen it already which gives a run-down of what you can do in these environments.
Using that, we’ve now built upon it and added two major enhancements to the SciChart.js developer experience. These are:
Read on to find out what this means & how it will level up your developer experience with SciChart.js
SciChart.js has over 200 hand-written documentation pages. In addition, over a thousand TypeDoc generated docs. You can view the SciChart.js documentation at scichart.com/javascript-chart-documentation.
One of the problems with keeping docs updated is that simple typo on page could result in a runtime or compilation error. Docs have to have up to date code samples that are tested and embedded in the page. Bonus points for a runnable sample (like JSFiddle or Codepen) in the page. The last problem is you can copy-paste the code sample, miss something and it still doesn’t work.
So what have we done to solve this?
Try it out!
Head over to scichart.com/javascript-chart-documentation, click on any documentation page under 2D Charts API or Axis APIs and you should see embedded samples like this.
So far we’ve completed all the pages under 2D Chart Types and Axis APIs. We intend to complete all the pages plus add new ones. This is a long process so bear with us!
Head over to any showcase demo on demo.scichart.com. Click on the ‘Code Sandbox’ button at the top of the page. This will open the demo in a stand-alone app inside Codesandbox – a brand new in-browser IDE that will let you edit the code, try new things and share results with your colleagues.
You’ll notice as well there’s a Docs button. This opens contextual documentation for the current example. Try it out!
CodeSandbox integration means we can extract each showcase demo as a standalone app. From there you can click Fork to save your own version of the sandbox. Try editing the code and see how it affects the chart!
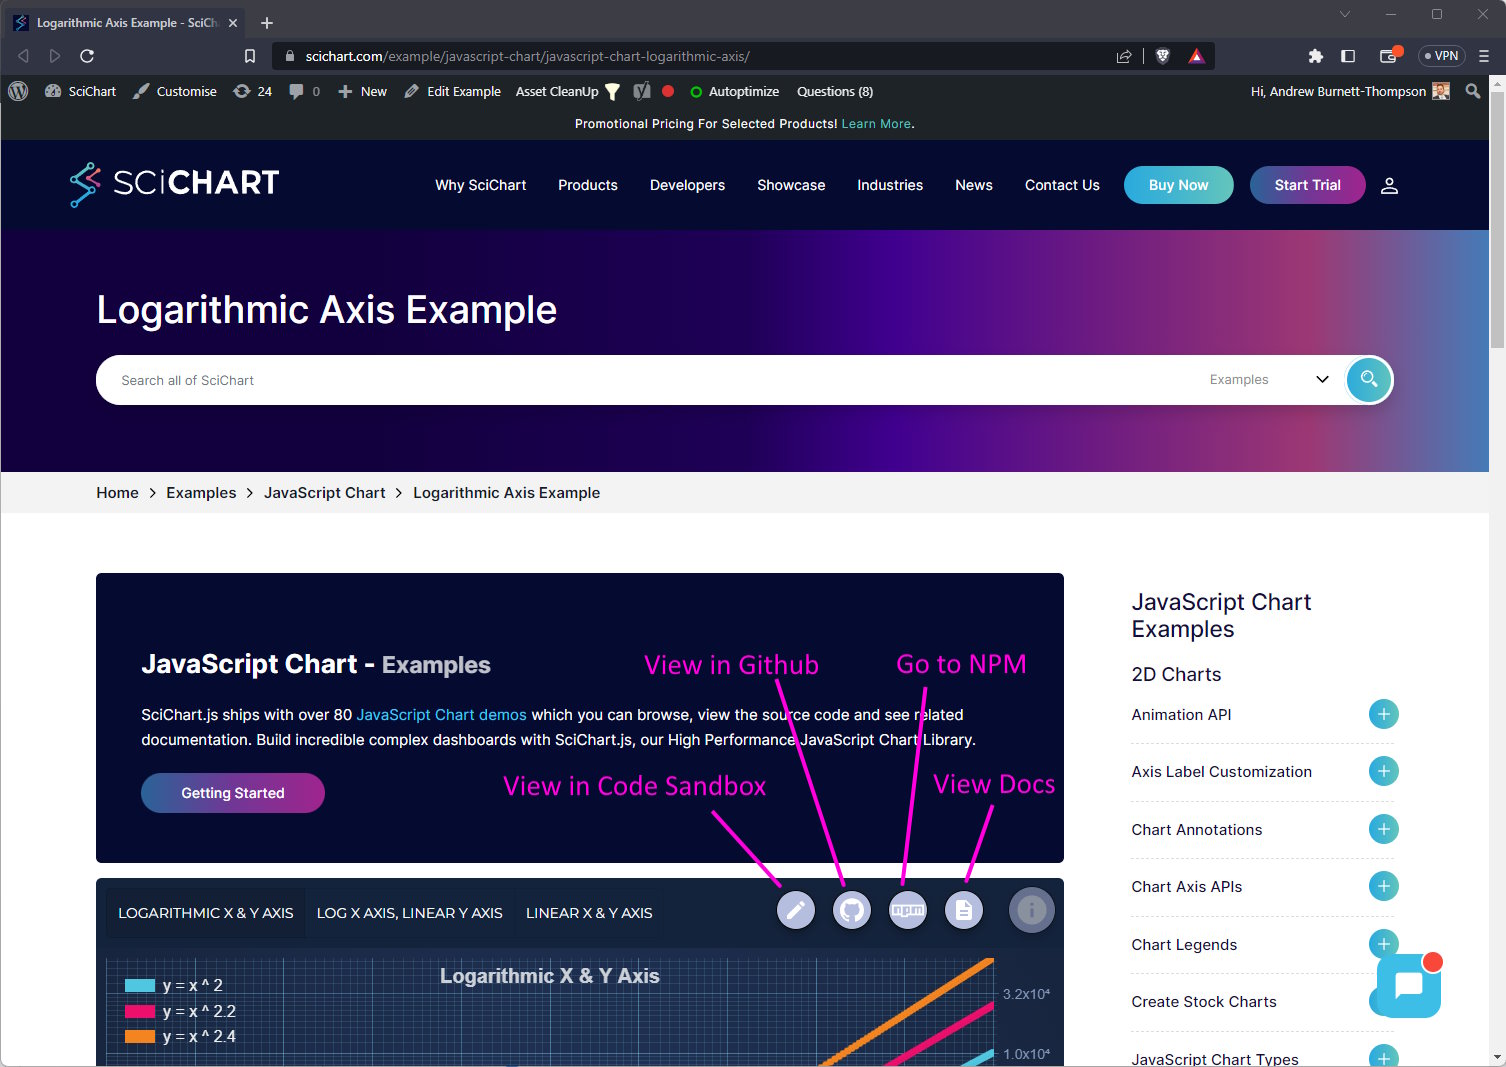
We’ve integrated the codesandbox toolbar into examples found on the main website as well.If you see this toolbar, hover over and you can do the same thing (open in codesandbox), as well as jump to contextual documentation for the example or demo.
Codesandbox plus this integration is relatively new. Some of the examples are showing an error like this:
RangeErrorPotential infinite loop: exceeded 10001 iterations. You can disable this check by creating a sandbox.config.json file.
These are the items on our roadmap to improve the developer experience with SciChart.js
Keep watching this space!
Best regards,
Andrew
Start using SciChart.js Today
SciChart.js is now available with a FREE community edition (no trial, sign-up or credit card required) where you can try out the library commercially or use it in a non-commercial application. If you have a question, or would like to give feedback, contact us.
Recent Blogs
![]()
Queens Award for Innovation
Proud winners of the Queens Award for Innovation, 2019. Awarded on account of our innovative graphics engine which underpins the SciChart library and enables our world-beating charting performance
![]()
National Business Awards
Highly Commended for Lloyds National Business Awards, 2019. Awarded on account of our innovative graphics engine and impressive customer base
![]()
National Technology Awards
Awarded “Healthcare Tech of the Year” at the 2025 National Technology Awards – a top UK recognition for breakthrough innovation in technology.

Reviews
SciChart has received hundreds of verified, 3rd party reviews