TradingView Alternative Comparison Guide for Big Data Apps
Discover why SciChart is a suitable TradingView alternative for developers who require high-performance, native financial charts without watermarks.

If you want to learn more about our open-source financial chart library for iOS and Android apps, you’re in the right place. This library is built on top of SciChart’s high-performance iOS chart library and adds new functionality, making it easy to create financial, trading and stock, forex or crypto apps with SciChart.

You can find the GitHub repos for each financial chart library below. These include iOS getting-started guides and iOS documentation for how to use and extend the library.
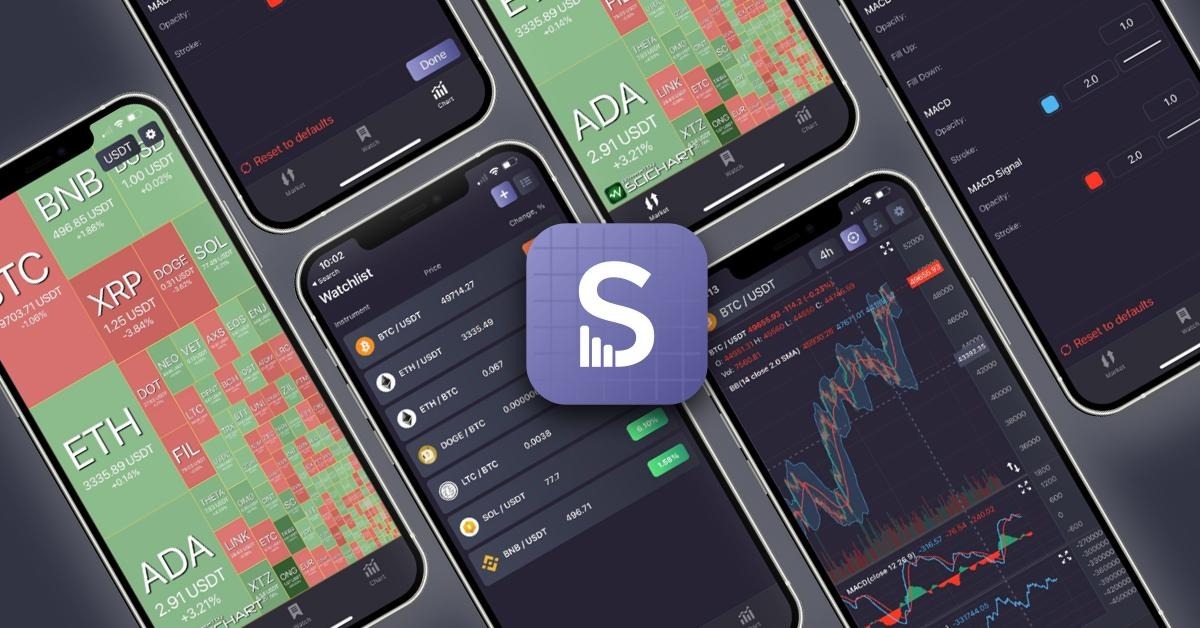
The best live demo of the Finance.iOS and Finance.Android library is the SciTrader app.
This is a free app using SciChart iOS/Android, and the Finance.iOS / Finance.Android library. It’s been published to the App Store and Play Store and shows what our library can do.
Learn more and install the free SciTrader cryptocurrency trading app and Altcoin Heatmap.
Finance Charts SDK adds professional-grade financial and stock charting capabilities for native iOS and Android apps.
It is built on top of SciChart, an award-winning, high-performance iOS chart library that also covers Android, Windows, and JavaScript apps.
Features include…
Create a financial stock chart on iOS/Android with technical indicators in just 10 lines of code:
// Swift (iOS)
func makeUIView(context: Context) -> SciFinanceChart {
let chart = SciFinanceChart()
let candleDataProvider = DefaultCandleDataProvider()
chart.candleDataProvider = candleDataProvider
fillDataProvider(candleDataProvider, with: DataManager.getCandles())
chart.studies.add(PriceSeriesStudy())
chart.studies.add(RSIStudy(pane: PaneId.uniqueId(name: "RSI")))
chart.isCursorEnabled = true
return chart
}
// Kotlin (Android)
override fun onCreate(savedInstanceState: Bundle?) {
super.onCreate(savedInstanceState)
setContentView(R.layout.activity_main)
SciChartSurface.setRuntimeLicenseKey("")
val chart = findViewById(R.id.financeChart)
val candleDataProvider = DefaultCandleDataProvider()
chart.candleDataProvider = candleDataProvider
fillDataProvider(candleDataProvider, DataManager.getCandles())
chart.studies.add(PriceSeriesStudy(PaneId.DEFAULT_PANE))
chart.studies.add(RSIStudy(PaneId.uniqueId("RSI")))
chart.isCursorEnabled = true
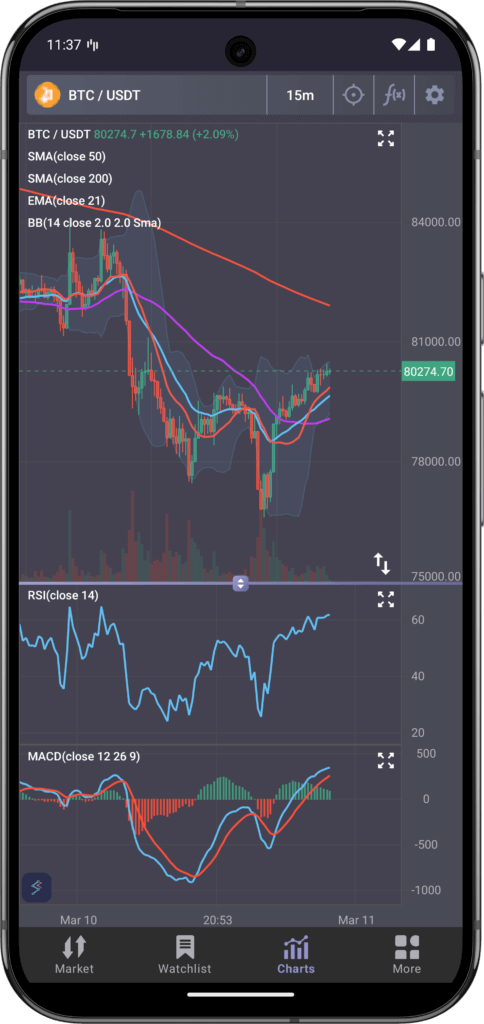
}This results in the following output:

Finance SDK contains 14 built-in studies (technical indicators), available out of the box. There is a special PriceSeriesStudy that displays candlesticks and volume bars. Others represent technical indicators, including:
… plus many more. It’s also possible to extend the library to add more studies & technical indicators. Take a look at the IndicatorBase class and how this is used.
The Finance.iOS and Finance.Android stock chart library also supports multiple panes for technical indicators. Panes can be resized by tapping and dragging the chart surface.
Our financial library is built for interactivity. Built-in, you will find rich zooming and panning. You can drag an axis to scale the axis, tap to pan, pinch to zoom and add or remove a cursor to the chart.
Watch the video below for a demo of the zooming and panning interactions on an iOS chart.
One of the most challenging aspects of building an Android or iOS stock chart app is handling data—whether that’s the updates or properties. Everything in the Finance.iOS and Finance.Android library is reactive, meaning if you change the input data, all technical indicators automatically update. If you change a property on an indicator or study, the chart will automatically update as well.
There’s a detailed description in the Finance.iOS Readme and Finance.Android Readme showing what the DataManager is and how it works.
If you are building a mobile app for trading in stocks, forex or crypto, then try out our open-source Finance.iOS and Finance.Android libraries.
These resources reduce a lot of development time, allowing you to get to market faster. It also provides stable, high-performance, feature-rich trading charts for mobile apps written in Swift and Kotlin.
If you run a brokerage, cryptocurrency or stock exchange, are a proprietary trading firm, hedge fund or CFD/spread bet provider, and are interested in SciChart for your trading apps, get in touch with our sales team to discuss your requirements.
We would love to hear from you and show how we can help get your product to market fast!
About SciChart: Cross-Platform Charts for Finance & Trading
SciChart is a market-leading chart component. With support for multiple platforms, including Windows (WPF, C#), native iOS and Android, Mac OSX and JavaScript charts. With our powerful, fast SciChart.js component, there’s a myriad of applications you can create from financial and scientific to medical and business dashboard apps.
Our customers (exchanges, brokerages and banks) use our award-winning iOS chart library to create desktop financial and trading apps, as well as mobile trading apps. We are working to add features for the fintech sector to make SciChart even more appealing to this market.
We also offer consultancy with our experts in finance and trading apps, as well as high-performance data visualization. If you wish us to develop an application or consult on the best way to use SciChart contact sales. We’re here to help!
Recent Blogs
![]()
Queens Award for Innovation
Proud winners of the Queens Award for Innovation, 2019. Awarded on account of our innovative graphics engine which underpins the SciChart library and enables our world-beating charting performance
![]()
National Business Awards
Highly Commended for Lloyds National Business Awards, 2019. Awarded on account of our innovative graphics engine and impressive customer base
![]()
National Technology Awards
Awarded “Healthcare Tech of the Year” at the 2025 National Technology Awards – a top UK recognition for breakthrough innovation in technology.

Reviews
SciChart has received hundreds of verified, 3rd party reviews