Platform: iOS (iPhone, iPad, iWatch)
Industry: Health & Fitness
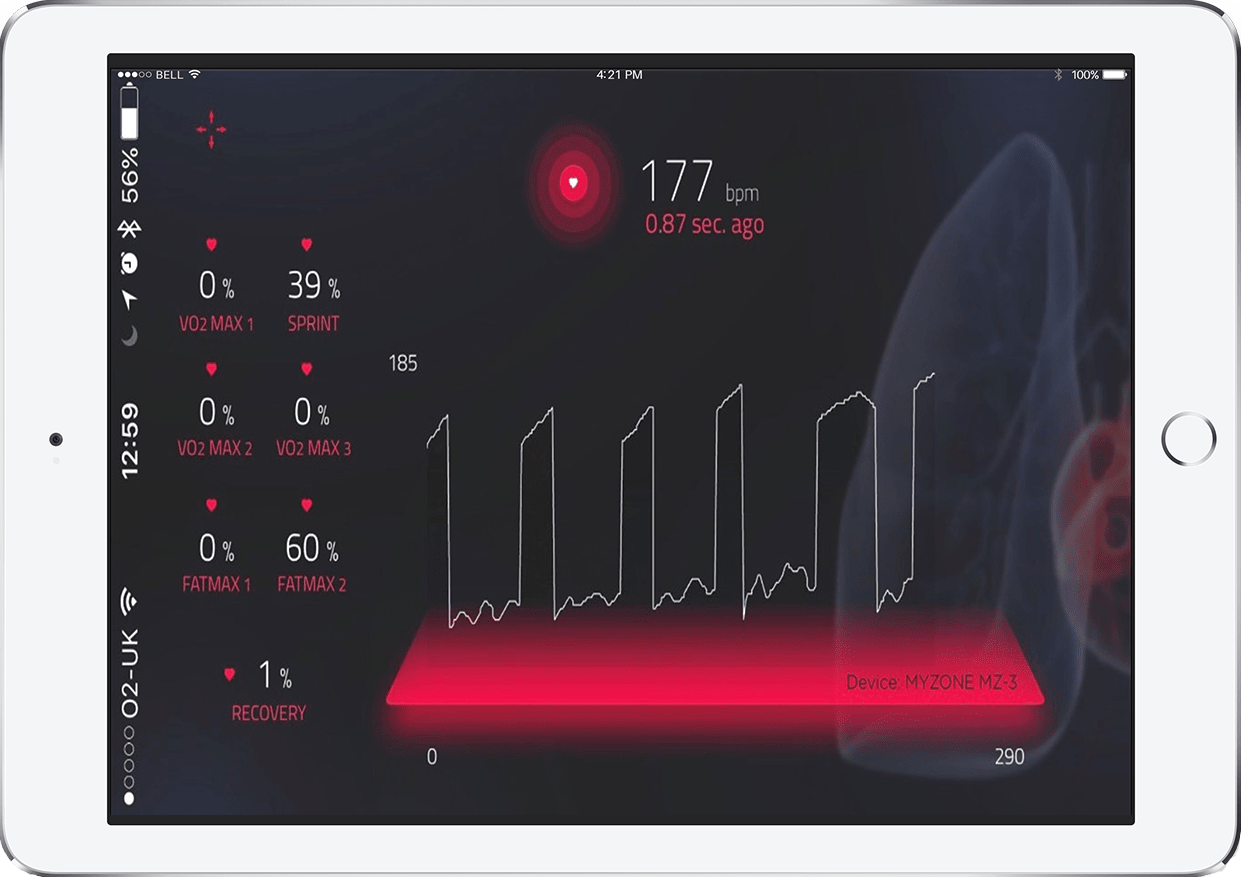
Requirements: To display 70,000 points of heart rate data accurately and in Realtime. Data is recorded live during custom training sessions to show the calculated “effort” index and true heart rate trends in a custom line and bar chart whilst maintaining a smooth UI across platforms.
Resources: 1 developer, 1 week;
Skills involved: Objective C, Swift 3, XCode;
Solution Provided: Custom series developed to show bar graph in the iHealth iOS App. Integration of SciChart into other parts of the app, namely line charts that could handle visualization of live data maintaining smooth, rich touch interaction with added panning, pinch zoom, drag and tooltips functionality.
Benefits: SciChart saved the customer weeks of time by replacing the open source charts with customized SciChart controls in just a few days. The team then provided ongoing support over e-mail.
