Read onto see how a PHD Research project from the Ocean University of China (Laoshan Campus) used Scichart to visualize High Frequency Data sets over multiple axis to promote the development of marine exploration technology using a custom portable spectrometer.
Platform: WPF
Industry: Spectroscopy, Scientific
The Laser Multispectral Diagnostic Analysis and Sensor Technology research group operating out of the Optics & Optoelectronics laboratory was seeking to improve marine exploration technology with a focus on the spectroscopic abilities of portable USB spectrometers. Previously limited by the charting capabilities they turned to SciChart to reinvigorate the sector.
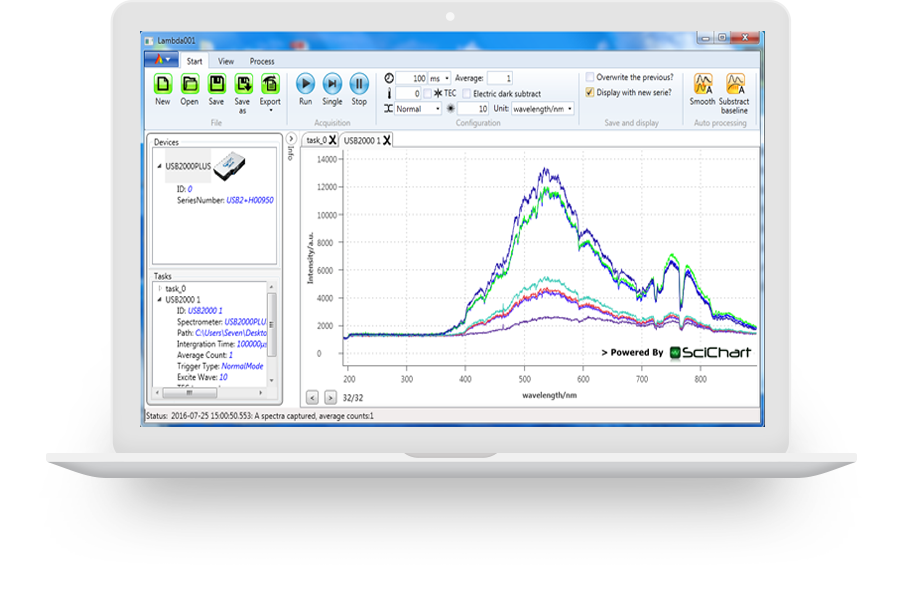
Challenge: To handle High frequency data sets at a rate of 2000 data points every 10 milliseconds whilst outputting in a customizable XY axis series and handle simultaneous line charts with a smooth UI.
Solution: Once implemented, SciCharts High Performance charting control handled the entire data set as well as being able to visualize multiple line charts and series. Extra features were added including positions of data values and process functions overlaid as annotations. This meant that the software interface would allow manufacturers to produce smaller spectrometers and support them.
