In this blog series we compare JavaScript Charts & JS Datavisualization Libraries. There are a wide range of libraries and frameworks for creating charts and graphs in React, JavaScript, Angular or Vue. Choosing the right one for your needs requires careful thought, and our helpful guides shed some light on the Best JavaScript Charts & Graphs to help you make the right choice for your DataVisualization applications.
In this post we’re looking at D3.js. We’re going to discuss what is D3.js, what are the pros & cons of this library, how to create charts with D3.js, plus improving the performance of D3.js and finally alternatives to D3.js for enterprise data visualization applications.
What is D3.js?
D3.js, which stands for Data-Driven Documents, is a JavaScript library renowned for its ability to produce dynamic, interactive data visualizations in web browsers. D3.js is not strictly a JavaScript Chart library, but more a low-level toolbox allowing you to create bespoke data visualisations, including but not limited to charts.
D3 utilises HTML, Canvas, SVG, and CSS. D3.js enables the manipulation of documents based on data, allowing for a wide range of visualization formats. It empowers developers to bind arbitrary data to a Document Object Model (DOM), and then apply data-driven transformations to the document.
One of D3.js’s strengths is its ability to generate complex, high-quality visualizations by combining powerful visualization components and a data-driven approach to DOM manipulation. This makes it a popular choice for creating interactive graphics, such as charts, graphs, and complex visualizations that are seamlessly integrated into web pages, enabling users to interact with and explore data in a more engaging and intuitive way.
How do you create Charts in D3.js?
As mentioned before, D3.js is not strictly a chart library, but allows you to create charts by composing primitives. One of the advantages of D3.js is because it’s very well known, you can use tools like Chat-GPT with GPT4 to generate code for charts.
For example, the Chat-GPT prompt:
> create a simple code example that I can paste into
a codepen to create a scatter chart with D3.js
… outputs useful code for D3.js that you can adapt to create a simple chart:
See the Pen
Simple Scatter Chart in D3.js by SciChart.js Official (@scichart)
on CodePen.
What are the Pros and Cons of D3.js?
Advantages of D3.js (Pros)
- Flexibility and Customizability: D3.js is renowned for flexibility, being able to create really unique visualisations from the ground up with its low-level API and SVG based rendering. It’s probably one of the most flexible data-visualization libraries on the market, but that comes with drawbacks, as we will see below.
- Lightweight Core Library: According to Bundlephobia, the package ‘D3’ is only 290kb minified and 93kb GZipped. Although this size may increase when adding plugins or extensions to achieve various outputs.
- Free Open Source Licensing: As a free open source library licensed under ISC license, D3 can be used in commercial projects, the source-code forked or modified, without charge
- Strong Community: With a very large community, and almost 40,000 questions under the tag [D3.js] on StackOverflow, D3 has one of the largest communities of an open source visualization library.
- Well known, with a desirable skillset: D3.js is very well known, and many developers include knowledge of D3 on their CVs. It’s a desirable skillset to learn and employers can find staff that have prior experience with D3 more easily. Because of the large number of publicly accessible applications, tools such as Chat-GPT can help you create some basic examples with D3.
Drawbacks or Disadvantages of D3.js (Cons)
- Learning Curve: The top complaint about D3.js is that its hard to learn. There is a very steep learning curve involved with creating charts using D3, and if a specific example doesn’t exist for what you are trying to create, you may spend some time learning the library and finding the right solutions.
- Complexity of API: D3.js is not specifically a chart library, but can be used to visualize charts (among anything else). As a result, some find the API complex and hard to get to grips with.
- Time to market: Related to complexity & learning curve, depending on the visualizations you want to put in your app, using D3.js may add significant development time to your application and require you to spend more time writing code to get the desired chart output.
- For example, chart operations that are considered standard like enabling common zooming and panning operations, cursors or tooltips, legends are not supported out of the box with D3.js, and need to be implemented by the user.
- Documentation: While D3 has a very strong community, and a great set of examples & demos, the documentation is limited and difficult to understand.
- Performance: As with other SVG Chart libraries, D3.js has a performance problem
- Users report “D3.js is unusably slow” with large datasets (anything over a few thousand points)
- D3.js has further performance problems on mobile devices, which have slower processors than desktop counterparts.
- Realtime updates require modifications to the DOM and SVG, which are also slow. As a result D3.js is not really suited for either big-data, or creating dynamic (real-time) charts
- 3D Chart Support: Using SVG means that D3.js cannot really be used to visualize 3D charts and graphs. Although some user-provided solutions such as integrating with Three.js exist
- Lack of Enterprise Tech Support: As with all open source libraries, one drawback is the lack of enterprise tech support. If you get stuck implementing something, you need to figure it out from community posts or StackOverflow.
Alternatives to D3.js
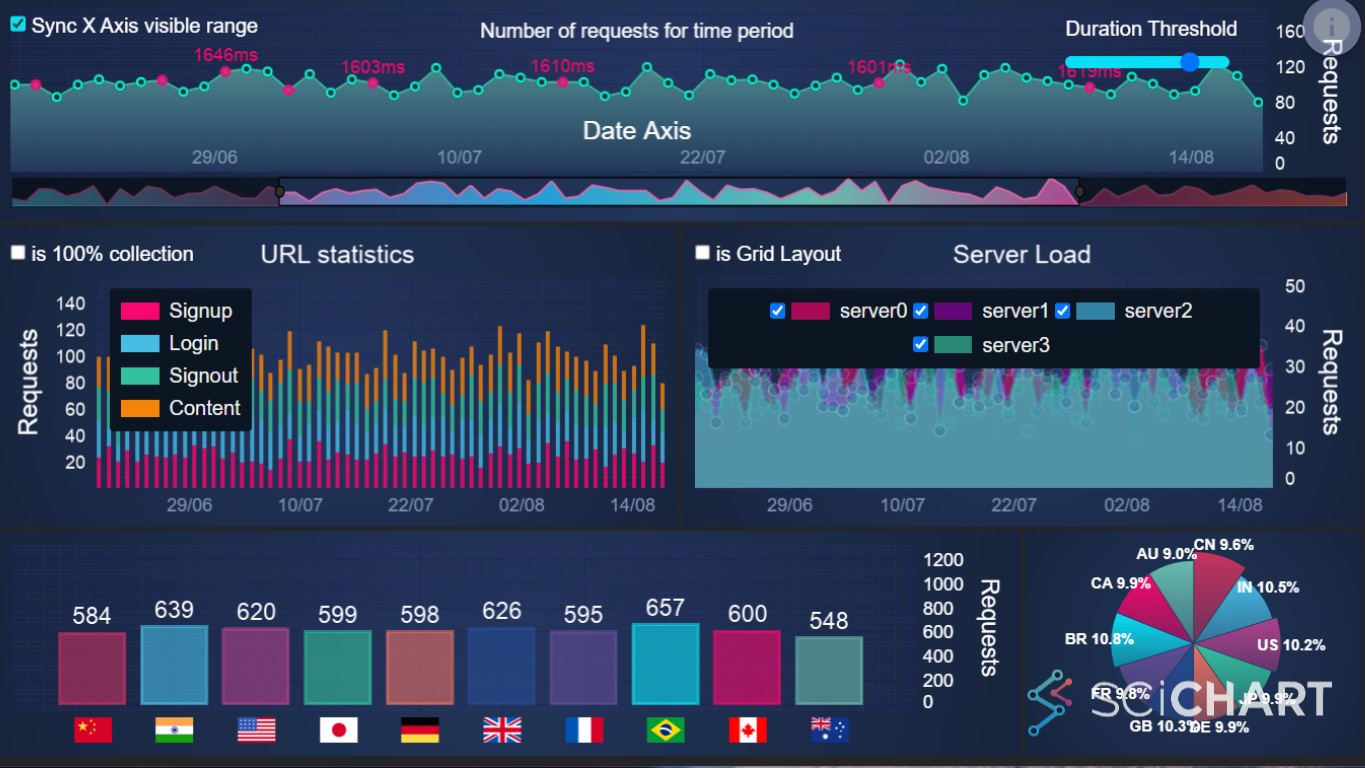
For applications which have demanding performance requirements or where charting is a mission critical part of the application, one alternative is SciChart. Below we explore the comparison of D3 and SciChart and present some advantages.
What are the Advantages of SciChart.js vs. D3.js?
- Very high performance for big datasets (1k, 10k, 100k, 1M, 10M+)
- Over 30 chart types including 2D & 3D charts out of the box
- Allows complex chart interactions, allowing you to create rich dashboards for real-time monitoring, server monitoring or visualizing telemetry data
- Specific focus on (but not limited to) scientific, engineering, financial as well as business and enterprise sectors
- Highly extensible API with many endpoints allowing for customisation, overriding or bespoke behaviour to fit your specific application needs.
- Very high quality, thorough documentation with embedded codepens
- Hundreds of JS and React chart demos online
- Enterprise tech support with fast bug fix turnaround and a frequent release schedule, allowing you to save time & money in your projects.
Learn more about SciChart.js
To learn more about SciChart.js or to discover its features in more detail, take a look at the webpage below:
Contact us to learn more
SciChart.js is a JavaScript Chart Library designed for complex, mission critical data visualization applications. If you have a question or would like to learn more about our products & services, please contact us:
Recent Blogs

