SciChart.js v6 in Alpha – WebGPU, Incredible Performance Gains and more
Our team has been working hard on continued R&D with SciChart.js – High Performance JavaScript Charts – and today we’d […]
In this blog series we compare JavaScript Chart Libraries. There are a wide range of libraries and frameworks for creating charts and graphs in React, JavaScript, Angular or Vue. Choosing the right one for your needs requires careful thought, and our helpful guides shed some light on the Best JavaScript Charts & Graphs to help you make the right choice for your DataVisualization applications.
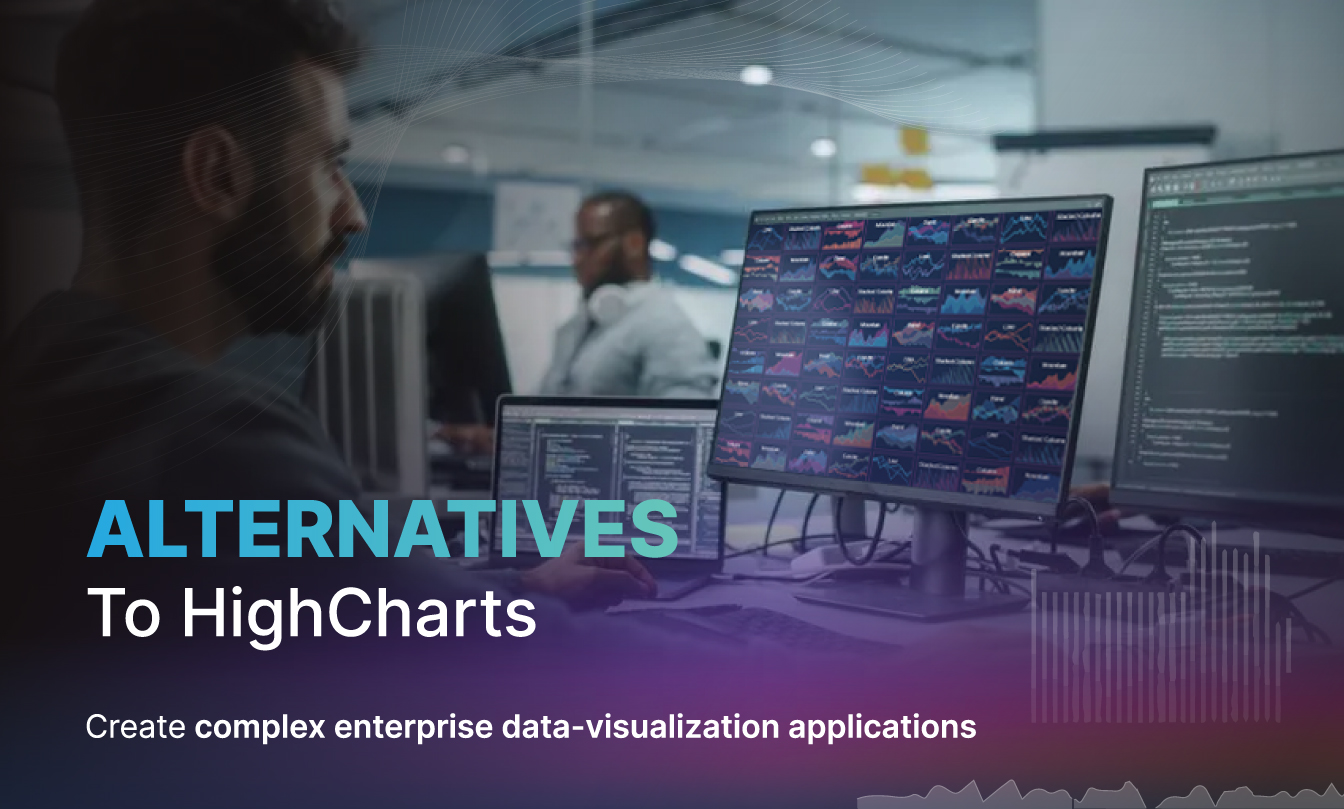
In this post we’re looking at HighCharts. We’re going to discuss what is HighCharts, what are the pros & cons of this library, how to create charts with HighCharts, plus using the Boost Library to improve the performance of HighCharts and finally alternatives to HighCharts for complex enterprise data-visualization applications.
HighCharts is a popular, commercial JavaScript chart library used for creating interactive charts & graphs within web applications. It started as a founders “humble quest for a simple charting tool to measure snow depth measurements”. It has since grown into a widely used and feature-rich JavaScript chart with a range of chart types including line charts, area charts, column charts, bar charts, pie charts, maps, gantt and more.
HighCharts stands out for it’s ease of use, with a simple clean API, a wide variety of chart types, plus plenty of high quality demos. It’s probably the best-known commercial JavaScript Chart library, but is it the best for complex enterprise applications? Find out more below.
Here are the advantages of HighCharts.
While HighCharts is a popular tool for datavisualization, it also has some limitations and disadvantages:
Customization Complexity
While the ability to customize the look & feel of the charts is a strength, achieving specific customizations to match business requirements can sometimes require extensive configuration. This may require a deep understanding of the library, which might be time-consuming.
Performance
While Highcharts handles moderate amounts of data efficiently, due to its SVG rendering it experiences performance issues when rendering larger datasets
According to internet searches, HighCharts can be slow and struggles with performance with large datasets or many charts on page (vi). For example, some google searches report:
Realtime or dynamic updates are possible, but performance problems are reported here also.
Pricing & License Structure
Some users report that pricing can be too high for small to medium enterprises or that the pricing and costs can be higher than expected (iv).
While starting at a very low price point, pricing for HighCharts can increase sharply when perpetual options, SaaS or OEM deployments, or features such as stock charts, maps or dashboards are included (v).
For example, a single developer license of HighCharts core starts at $168 per year for an annual subscription.
However, if you select these options on the store, the pricing now jumps to over $32,000 (v)
Rendering performance or chart drawing speed often comes up as a disadvantage of HighCharts (vi). For a simple application with no more than a few JS charts with relatively small data sets, this may not be a problem. However, data is getting bigger and bigger all the time.
Dashboards in business applications may have to deal with tens of charts, each with a number of series and thousands of data-points per series. This can add up to a huge problem as requirements become more complex.
The recommendation from HighCharts to improve performance include disabling animations, and applying the Boost module, which provides a stripped down version of the chart with WebGL acceleration. However, according to the HighCharts official documentation (vii) (viii) (ix) many limitations apply to HighCharts Boost, such as:
As a result, while it is technically possible to achieve JavaScript charts with large numbers of data-points with HighCharts and Boost, the actual functionality and performance may be limiting for enterprise applications requiring big data handling.
For applications which have demanding requirements, complex dashboards or big-data / performance requirements one viable alternative is SciChart.js.
SciChart.js has been designed from the ground up for extremely demanding, big-data and high performance applications. Built on-top of a proprietary, cross-platform rendering engine using C++ SciChart supports targetting WebGL as well as desktop and mobile based hardware-acceleration APIs such as OpenGL, DirectX, Metal.
With a fully JavaScript, TypeScript API and React library support, SciChart can integrate seamlessly into enterprise apps, enabling mission-critical visualization projects without compromising on functionality. Key customers of SciChart include medical users such as Siemens, Formula One, Nasa, financial users such as JP Morgan and more.
When compared to HighCharts, SciChart.js has the following advantages:
To learn more about SciChart.js or to discover its features in more detail, take a look at the post below:

Learn more about the features & benefits of SciChart.js: an enterprise-grade alternative to HighCharts, which allows you to integrate complex & demanding JavaScript & React Charts your applications. … Continue reading High Performance JavaScript Charts & Graphs for Enterprise Applications
Alternatively, to see in-depth performance of SciChart vs. several chart libraries including HighCharts, read the article with a performance comparison below:
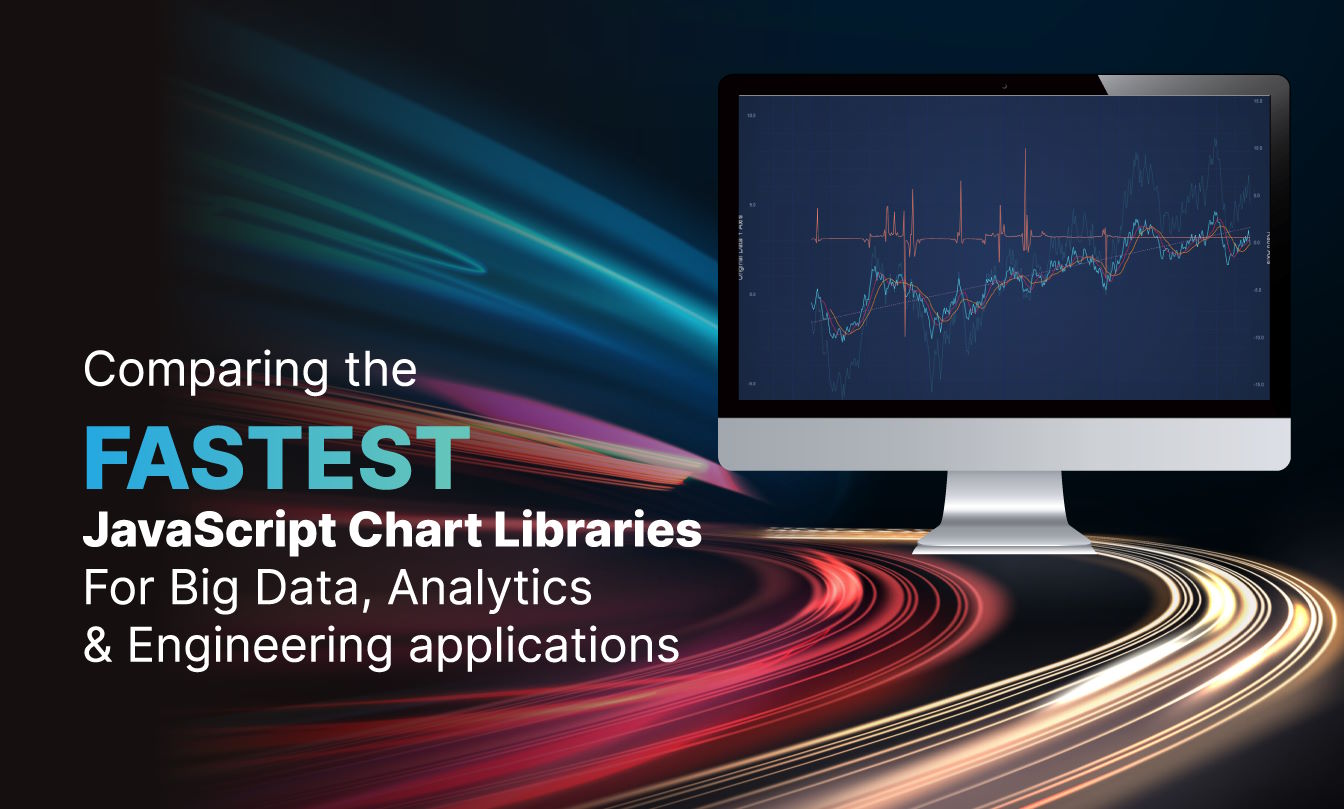
In this post, we compare the performance of SciChart.js, a WebGL hardware accelerated chart library with HighCharts (with / without Boost), Chart.js and Plotly.js. In all performance tests, SciChart outstrips competitor performance considerably, making this a strong choice for applications which require big-data, or where the application is visualization heavy … Continue reading Comparing the Performance of SciChart vs HighCharts, Chart.js and Plotly
Contact us to learn more
SciChart.js is a fully WebGL accelerated JavaScript and React Chart Library designed for complex, mission critical data visualization applications. Now with a FREE community edition. If you have a question or would like to learn more about our products & services, please contact us:
Recent Blogs
![]()
Queens Award for Innovation
Proud winners of the Queens Award for Innovation, 2019. Awarded on account of our innovative graphics engine which underpins the SciChart library and enables our world-beating charting performance
![]()
National Business Awards
Highly Commended for Lloyds National Business Awards, 2019. Awarded on account of our innovative graphics engine and impressive customer base
![]()
National Technology Awards
Awarded “Healthcare Tech of the Year” at the 2025 National Technology Awards – a top UK recognition for breakthrough innovation in technology.

Reviews
SciChart has received hundreds of verified, 3rd party reviews