Building a Smith Chart in JavaScript: Inside the Rendering Pipeline
See how SciChart.js was extended to build a fully interactive Smith chart using standard APIs. This article highlights the flexibility of custom rendering and advanced interactions.

One of the decisions we took when building SciChart.js – our high-performance JavaScript chart library – was to pioneer the use of WebAssembly with JavaScript. This allowed us to reuse our C++ code base targeting OpenGL and WebGL which had already been well tested on our windows and mobile versions of SciChart, and bring our award-winning technology into the browser.
The main benefits of our unique tech stack are not only code-reuse and efficiency, but also enabling extremely performant charts & data visualisation for our users. SciChart.js is the fastest JavaScript chart library available for plotting big data, and in some cases outperforms traditional HTML5 Canvas or SVG charts by over 100x. SciChart enables a whole host of applications in JavaScript: such as embedded systems, scientific applications and medical applications, that were previously impossible. Having a faster chart component also means more it’s efficient: the library can be run on devices with lower power processors, meaning a cheaper cost of production for embedded systems.
The technology of WebAssembly with JavaScript is fantastic, but it doesn’t come without its challenges which we will go into below, and then talk about our solutions.
WebAssembly has a completely different memory model to JavaScript. While JavaScript has a garbage collector, which automatically cleans up the memory of variables which are no longer required, WebAssembly simply does not. An object or buffer declared in Wasm memory must be deleted by the caller, if not a memory leak will occur. Memory leaks can occur in both JavaScript and WebAssembly, and care and attention must be taken by the developer to ensure that memory is correctly cleaned up when using SciChart.js.
Despite being a Garbage-Collected managed programming language, it’s still extremely easy to create a memory leak just in vanilla JavaScript. Here are a couple of ways that is possible to inadvertently leak memory in a JavaScript app:
Wasm has a separate heap to the JavaScript virtual machine. This memory is allocated in the browser, and reserved from the host OS. When you allocate memory in Wasm, the Wasm heap is grown and a range of addresses are reserved. When you delete memory in Wasm, the heap does not shrink and memory is not returned to the host OS. Instead the memory is simply marked as deleted or available. This means it can be re-used by future allocations.
To cause a memory leak in WebAssembly you simply need to allocate memory and forget to delete it. Since there is no automatic garbage collection, finalisation or marking memory as no longer needed, it must come from the user. SciChart.js has a function .delete() on objects that use Wasm memory. This needs to be called when the object is no longer required, for example:
// Create a SciChartSurface
const { wasmContext, SciChartSurface } = await SciChartSurface.create("divId");

// Add axis and series
sciChartSurface.xAxes.add(new NumericAxis(wasmContext));
sciChartSurface.yAxes.add(new NumericAxis(wasmContext));

sciChartSurface.renderableSeries.add(new FastLineRenderableSeries(wasmContext, {
   dataSeries: new XyDataSeries(wasmContext, {
       xValues: [0,1,2,3],
       yValues: [4,5,6,7]
   })
});

// When finished with the chart ...
//

sciChartSurface?.delete();
sciChartSurface = undefined;
This brings a new challenge to JavaScript developers using SciChart.js as it is simply not commonplace to have to manage and delete memory when building a JavaScript application. Forgetting to call .delete() in your application can over time leak memory.
To add to this, we recently learned much more about the WebAssembly memory model. In the current version of WebAssembly, allocation and deletion of memory is more basic than counterparts like Java or C#.
Wasm’s memory model, if used incorrectly, can result in memory fragmentation. Imagine that you allocate an array of 10,000 numbers (64-bit floating point values). This requires 80,000 bytes of continuous memory to be available. Once you have finished with the buffer and you delete it this memory is now marked as free and can be reused. However if you now need to allocate an array of 11,000 numbers, requiring 88,000 bytes of continuous memory, it will not fit into the previous space. So the Wasm heap must grow in size to 168,000 bytes. Over time, memory can become fragmented and you can end up with a large heap of allocated memory in WebAssembly that cannot be fully utilised.
C# .NET and Java solve this by having heap compaction during garbage collection. When the GC is run, periodically the entire application execution is paused, and the heap is defragmented or compacted. This keeps memory usage low, but at the expense of your application stuttering momentarily. We recently learned that WebAssembly does not compact the heap, so we have to be extra careful about allocations and deletions and use of memory in order to keep your application running smoothly.
SciChart.js v3.2 ships with a number of memory debugging tools that can notify you if you have incorrectly cleaned up variables, or forgotten to delete WebAssembly memory or objects that have been declared.
Read the full guide over at the SciChart.js Documentation: Memory Leak debugging
Enabling memory leak debugging is possible by setting the static property MemoryUsageHelper.isMemoryUsageDebugEnabled = true.
import { MemoryUsageTracker } from "scichart";

MemoryUsageHelper.isMemoryUsageDebugEnabled = true;
After enabling the memory usage helper you should see a message in the console output like this:

Once MemoryUsageHelper is enabled, the memory usage debugging tool has two features:
This allows you to track the state of the registry and be notified on stray objects that have either not been garbage collected (where the solution is to ensure all references to that object have become detached), or be notified of objects that you’ve forgotten to delete (where the solution is to call .delete()).
You can then get the state of the object registry at any time by calling:
MemoryUsageHelper.objectRegistry.log();Now read the Chrome Dev tools console to uncover reasons for leaked Wasm memory.
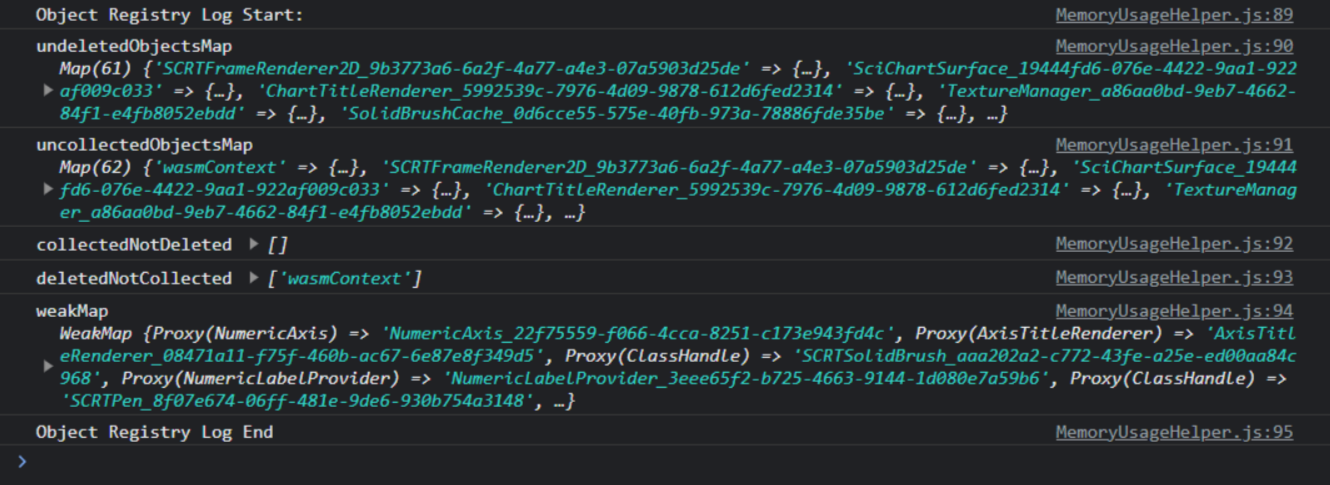
Above: Sample screenshot from SciChart.js’ JavaScript memory leak detection tool. For more info see Documentation: Memory Leak Debugging
We’ve made a few other improvements in SciChart.js v3.2 and above, in how we handle memory, making this the most efficient version of SciChart.js ever.
Start using SciChart.js Today
SciChart.js is now available with a FREE community edition (no trial, sign-up or credit card required) where you can try out the library commercially or use it in a non-commercial application. If you have a question, or would like to give feedback, contact us.
Recent Blogs
![]()
Queens Award for Innovation
Proud winners of the Queens Award for Innovation, 2019. Awarded on account of our innovative graphics engine which underpins the SciChart library and enables our world-beating charting performance
![]()
National Business Awards
Highly Commended for Lloyds National Business Awards, 2019. Awarded on account of our innovative graphics engine and impressive customer base
![]()
National Technology Awards
Awarded “Healthcare Tech of the Year” at the 2025 National Technology Awards – a top UK recognition for breakthrough innovation in technology.

Reviews
SciChart has received hundreds of verified, 3rd party reviews