Improve Real-Time Cardiovascular Monitoring Across All Devices
Cardiovascular monitoring charts, including ECG and EKG applications, require stability and reliability. For PDAs (Personal Digital Assistants) and MedTech clients, the challenge is capturing that enhanced chart performance even on smaller hardware devices, such as mobile phones. This requires a cross-platform solution.
An electrocardiogram (ECG) is a medical test used to check the heart’s rhythm. While it may be a simple test, it isn’t necessarily easy to visualize and maintain data stability. This is especially the case when using multiple devices or applications simultaneously.
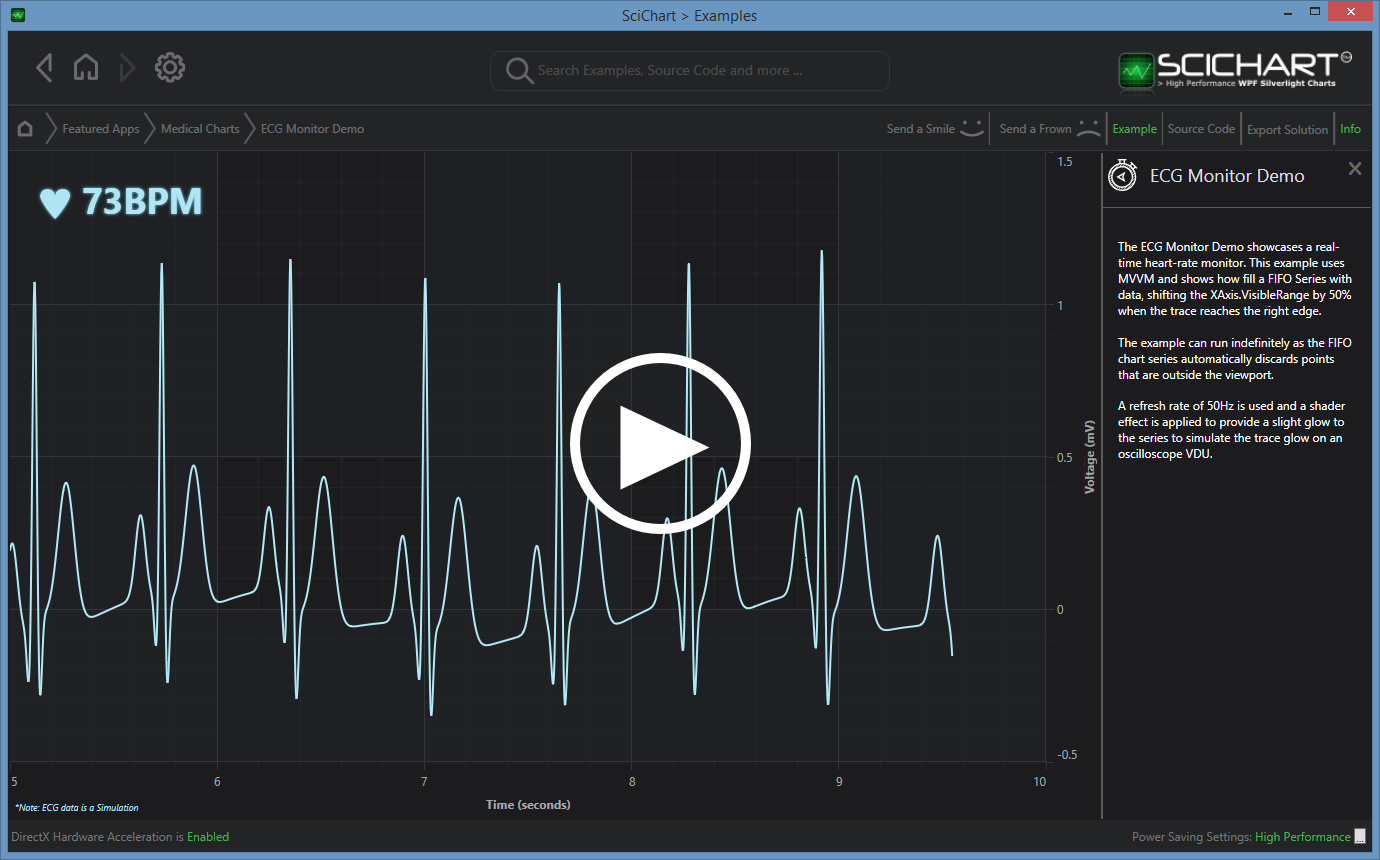
Real-time WPF visualisation of FIFO data and waveforms can be used to draw real-time ECG/EKG charts and graphs. These can be used to monitor heart rate, body temperature, blood pressure, pulse, SPO2 blood oxygenation, and volumetric flow of other vital signs.
Reduced data efficiency when using smaller devices, such as tablets or mobile phones, can slow down data rendering speeds and hinder medical analysis.
Software solutions, such as those offered by SciChart, deliver high-performance and responsive charts on any browser or device. Even with less processing power, SciChart can power high volumes of real-time data – ideal for ECG signal visualization.
Dynamic WPF Visualization of ECG signals in Realtime
Cardea Labs needed a software solution with a smooth user interface that was also portable. The solution had to enable increased functionality, including overlaid information, while still being user-friendly.
SciChart’s extensive charting examples were used to create the FIFO functionality required, which generated a real-time scrolling ECG monitor. The session window was upgraded to make use of the pan, zoom, and scroll functions, making the UI intuitive and user-friendly. SciChart’s high-performance capabilities could handle 250 points per second in real-time even when being used on smaller portable devices.
Real-time Waveform Visualization of Cardiovascular Data
Avicena Heart attempted to use other commercial and open source iOS Charting Software to plot Waveforms in real time but found it deficient in many ways:
- Inability to handle multiple data streams
- Difficulty handling Realtime High bandwidth data
- Little to no customization
- Poor UI
SciChart’s exceptional performance of large datasets can render over a million points in a line at interactive frame rates, handling real-time data streams easily.
Native code, GPU-acceleration and a high-performance iOS charting library, generated the ultimate data rendering efficiency. Avicena could now handle up to 90 data series simultaneously.
Rich Chart Annotations API enabled the creation of fully interactive, customizable chart annotations as well as change the appearance of the entire chart.
High performance WPF visualization of ECG signals

See the full WPF ECG Monitor Chart Demo
Using high-performance charts with endless customizations and flexibility has plenty of real-world benefits. We’ve seen our charts help pave the way for faster and more reliable diagnosis, as well as improving the efficiency of healthcare staff.
With the ability to link multiple charts, or have many traces on one chart control, plus smooth realtime updates, SciChart is perfect for ECG / EKG applications. Our charts are used in healthcare applications across platforms, as well as instrumentation and test devices for the medtech industry.
With SciChart, you can simultaneously shortcut your medical chart development and outperform standard methods of cardiovascular diagnosis.
- Handle high bandwidth multi series data streams
- Bespoke customization
- User friendly interfaces
How does SciChart help improve efficiency across devices?
- Proprietary resampling algorithms to reduce the dataset before drawing
- Immediate mode rendering
- Object pooling
- Resource re-use
Build your ECG / EKG Applications with SciChart today.
Recent Blogs
