Pre loader
Try wave

Promotional pricing for SciChart WPF!

WPF 3D
Chart Library

SciChart 3D for WPF is a Realtime, High Performance, WPF 3D Chart Library made with Financial, Medical, Scientific Apps in mind. Perfect for projects that need Extreme Performance and rich, interactive 3D charts.

Get the Job Done with our DirectX powered WPF 3D Charts and Extensive API.

Get Started

The World’s Best WPF Charts keeps getting better!

star starstarstarstarstar 4.84 Average - 419 Reviews

The SciChart for WPF v5 SDK now contains a DirectX-powered WPF 3D Chart control, including WPF 3D Bubble Charts, WPF 3D Scatter Charts, WPF 3D Point-Cloud Charts, WPF 3D Column Charts, WPF 3D Impulse (Stem) Charts, WPF 3D Surface-Mesh and WPF 3D Point-Line. With our SciChart WPF 3D Chart library built on a flexible DirectX-powered rendering engine and our legendary core charting APIs plus our helpful tech support, it’s not hard to see why we’re number #1!

Buy Now
quote
Steven I
star
star
star
star
star
Without doubt, the best charting library I have ever used. The examples suite is comprehensive to easily get you started coding on a new project. The sales & technical support staff are always responsible and eager to help. Chart customisation is extensive and rendering speed is quick.
quote
Chris Kirkman
star
star
star
star
star
This is an incredible product. First it's the best chart I've had customers compliment how great the charting parts of our application look/behave. I couldn't recommend this product anymore than I already do. SciChart really hit the mark. I wish all software products could be this easy to use and be so productive (not to mention blazing fast).
quote
Mete Alinc
star
star
star
star
star
This is a wonderful tool for developers who need highly customizable and fast charting in 2D or 3D. I did a comprehensive market research in terms of what kind of charting I have to use for a commercial app. I've come to the conclusion that SciChart is simply the best charting framework out there meeting our needs. Keep up the good and quality work!
quote
Jack L
star
star
star
star
star
SciChart has always provided timely and expert support for an already superb product. The WPF charting solution is at the heart of our user interface. We are an extremely satisfied, long term customer.

Why Choose SciChart’s WPF 3D Charting Library?

There are many reasons why Scichart’s WPF 3D chart library is the best around, but below are some of the key features you should know!

15x WPF 3D Chart Types plus 35x WPF 2D Chart Types

With many 3D Chart-Types to choose from, plus the potential to extend infinitely via our flexible DirectX-powered rendering engine, you’ll be spoilt for choice with SciChart’s WPF 3D Chart Library!

WPF 3D Chart Performance

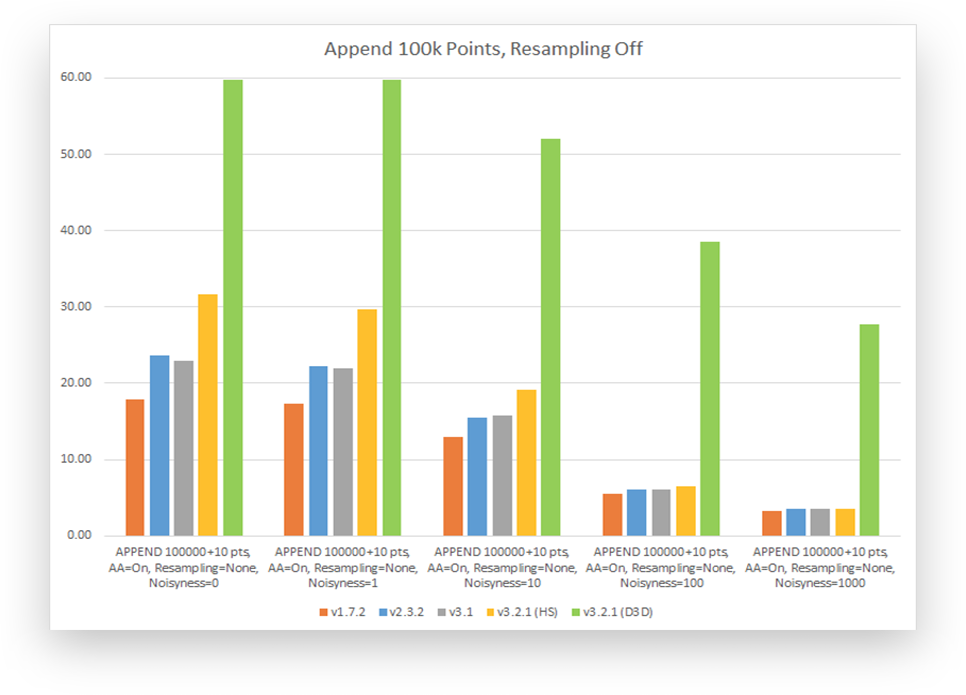
Our legendary WPF 3D Charting performance is provided by a mixture of extensive end-to-end performance optimisations, unsafe code, C++ interop, DirectX rendering engine and intelligent culling / resampling algorithms. You just won’t find real-world charting performance quite like SciChart!

With SciChart’s WPF 3D chart library, it is now possible to display 16,000 x 16,000 surface-meshes (statically) or 1,000 x 1,000 surface-meshes in real-time, or 1,000,000+ points scatter chart / point-clouds in real-time.

With SciChart 2D, it is now possible to display 10,000,000+ point line-charts, 1,000,000+ point scatter charts, or 1,000,000+ bar candlestick charts and update in real-time. It’s now possible to display thousands of series, or hundreds of chart surfaces on a single UI without stalling the rest of your user interface.

Rich Core WPF 3D Charting API

Our core SciChart WPF Charts API has been refined over four years with feedback from thousands of developers and end-users. Our 3D WPF Chart control builds on the amazingly rich core charting API by sharing core code for Axis Ranging, Label Formatting, Chart Modifiers (interaction) and RenderableSeries.

Download Free Trial View Pricing

Axis Types and Config
Cursors and Tooltips
MVVM Friendly API
MVVM Friendly API
Rendering Properties
Selection & Hit-Test
Theming
Theming
Zooming / Panning
Zooming / Panning
  • Numeric (double), DateTime, TimeSpan and Logarithmic Numeric Axis Types
  • Override Axis Label Formatting
  • Override Axis Tick Frequency
  • Toggle Gridlines, Ticks and Bands On or Off
  • Supports Axis Titles
  • Programmatic Axis World-Coordinate to Data Conversion API
  • Mouse-hover tooltips on all chart-types
  • Mouse-click Selection of scatter points and columns in 3D
  • Pass Business-objects (Metadata) through to Tooltips via PointMetadata3D API.
  • Per-series Templatable WPF Tooltips
  • MVVM Friendly API allows declaring the View in XAML and data in ViewModels.
  • Manipulate Data in ViewModels and get automatic updates on the Chart
  • All control properties are Dependency Properties allowing for binding and an intuitive WPF 3D Charting API
  • Trigger Redraw from MVVM or code.
  • Control whether Zoom/Pan Behaviour is enabled from MVVM or code.
  • Bind Tooltips to Business Objects via the PointMetadata3D API
  • FAST Immediate-Mode, DirectX powered rendering in WPF
  • DirectX9c, 10, 11 support
  • Renders over remote desktop and screen share
  • Color points individually with PaletteProvider3D API
  • Height-map / gradient fills on Surface Mesh types
  • Color Fills and Strokes
  • 3D Data-point markers: Cube, Sphere, Pyramid
  • Fast 2D Data-point markers: Ellipse, Square
  • Access to our 3D Engine to draw your own geometry
  • Hit-Test API for mouse click/hover of series, points.
  • Rich ChartModifier3D API for overriding MouseDown, MouseMove, MouseUp, Touch behaviours on the chart
  • Data-point Selection programmatically or via the mouse
  • Nearest point to mouse / Is Over point via Hit-Test API
  • Data-Point Selection API. Click to select or programmatically select data-points in 3D
  • 8 Stunning Themes to choose from
  • Create Custom Themes easily
  • Override Properties in XAML, e.g. Background, Gridlines, Text Color, Series Stroke and Fill
  • XAML Styling for Axis, RenderableSeries, Tooltips, Legends and more
  • Intuitive, WPF-Friendly API
  • Create Stunning looking Charts with Modern Styles!
  • Orbit the Chart by dragging the Mouse
  • Free-look by dragging the mouse
  • Free-move with keyboard shortcuts W-A-S-D
  • Zoom via Mousewheel
  • Zoom to fit via mouse-double-click
  • Programmatically change Camera Position, Target
  • Perspective / Orthogonal Camera modes

Comprehensive WPF Charting Examples and Documentation

No other WPF 3D Charting library vendor supplies such comprehensive examples and documentation! Our examples suite contains over 130 live code examples which you can export to a stand-alone Visual Studio project straight away. SciChart WPF 3D Charts are backed by 1,500 forum questions, 300+ pages of documentation as well as a knowledgeable and responsive development team to help you achieve the best from SciChart.

Slide image number 1
Slide image number 2
Slide image number 3
Slide image number 4
Slide image number 5
Slide image number 6

Active Development

150,000 lines of code, 6,100 unit tests, 11,500 check-ins!

SciChart WPF Charts now have over 150,000 lines of code, covered by 3,600 unit and integration test and 7,500 check-ins to version control over four years of development. We are the most actively developed WPF Chart control in the world and continue to add features and fix bugs/issues reported by our user base.

Continuous Delivery

Noticed a bug with our WPF 3D chart library? Report the bug, sometimes we fix it same-day and push to NuGet / GitHub. If you’re a SciChart customer, you can get the code changes within minutes and apply them to your build, allowing you to get on with your day-to-day business. How many can say that!

Trusted by Thousands of Developers Worldwide

SciChart’s charting software is trusted by thousands of developers worldwide and has customers in almost 80 countries from sectors including Pharmaceutical, Oil & Gas, Medical, Instrumentation, Defence, Aerospace, Motorsport, Process Automation, Mining, Investment Banking, Trading and more. See what our customers say about us!

All this starting from $2099 / Developer License

SciChart’s WPF 3D Chart library together with 2D charts are included to SciChart WPF SDK Professional Product. SciChart is licensed on a perpetual, per-developer licensing model, with royalty free redistribution. You get access to our DirectX powered WPF 2D and WPF 3D Charts, starting from just $2099 per developer license.

BUY NOW

Try SciChart Today

Start a trial and discover why we are the choice
of demanding developers worldwide

Start TrialCase Studies