DirectX Compatibility in WPF Charts with SciChart
SciChart now features an optional DirectX10 based renderer. This is currently included as an add-on to the SciChart High Performance […]
A common requirement that people ask of SciChart is the ability to overlay markers or other annotations on a chart. This is a feature we’re very interested in developing and making as easy as possible for end users. In the current version of SciChart (v1.3.0) there is a basic annotations API which can be used to position and update an UIElement over the chart surface. This tutorial aims to show you how you can do this.
A user wants to be able to display a stock chart with markers for trades (buys, sells). Each trade should be say an up or down arrow. The trade markers should be displayed at the time of the trade and near the price of the trade. Finally, as the chart updates the trade markers should reposition themselves.
Ok so lets start by creating some Xaml and code-behind to create the chart:
Xaml
<SciChart:SciChartSurface x:Name="sciChart" SciChart:ThemeManager.Theme="BrightSpark" Rendered="SciChartSurfaceRendered">

<SciChart:SciChartSurface.RenderableSeries>
  <SciChart:FastCandlestickRenderableSeries/>
</SciChart:SciChartSurface.RenderableSeries>

<SciChart:SciChartSurface.YAxis>
  <SciChart:NumericAxis AutoRange="True">
<SciChart:NumericAxis.GrowBy>
  <SciChart:DoubleRange Min="0.1" Max="0.2"/>
</SciChart:NumericAxis.GrowBy>
  </SciChart:NumericAxis>
</SciChart:SciChartSurface.YAxis>

<SciChart:SciChartSurface.XAxis>
  <SciChart:CategoryDateTimeAxis/>
</SciChart:SciChartSurface.XAxis>

</SciChart:SciChartSurface>
C#
public partial class SimpleAnnotations : Window
{
    List _trades = new List();

    public SimpleAnnotations()
    {
        InitializeComponent();
    }

    private void SimpleAnnotationsLoaded(object sender, RoutedEventArgs e)
    {
        // Create some data to display
        var dataset = new DataSeriesSet();
        var series = dataset.AddSeries();

        // Get some data to display
        var prices = DataManager.Instance.GetPriceData("INDU_Daily");

        series.Append(prices.TimeData, prices.OpenData, prices.HighData,
                      prices.LowData, prices.CloseData);

        sciChart.DataSet = dataset;
    }

    private void SciChartSurfaceRendered(object sender, EventArgs e)
    {
        // TODO: Draw trade markers
    }
}
This should result in something like the following:

Next, we need to add our markers. To do this we need three things: A trade class to hold trade data, a marker UIElement to render, and some code in the SciChartSurfaceRendered event handler to update the marker positions.
Let’s start with the Trade class:
public class Trade
{
    public BuySell BuySell { get; set; }
    public double DealPrice { get; set; }
    public DateTime TradeDate { get; set; }
}
Next, let’s create the UIElements to render as markers. We’re going to declare these in Xaml but clone them in the code-behind to draw many instances over the chart.
<!-- Inside the MainWindow.xaml -->
<Window.Resources>

  <Path x:Key="ShortMarker"
        Width="12"
        Height="14.5"
        Data="m 3.5 0.5 4 0 0 8 3 0 -5 5 -5 -5 3 0 z"
        Fill="#57B22020"
        Stroke="#FF990000"
        StrokeEndLineCap="Flat"
        StrokeLineJoin="Miter"
        StrokeStartLineCap="Flat"
        StrokeThickness="1" />

  <Path x:Key="LongMarker"
        Width="12"
        Height="14.5"
        Data="m 4 14 4 0 0 -8 3 0 -5 -5 -5 5 3 0 z"
        Fill="#571CB61C"
        Stroke="#FF00B400"
        StrokeEndLineCap="Flat"
        StrokeLineJoin="Miter"
        StrokeStartLineCap="Flat"
        StrokeThickness="1"/>

</Window.Resources>
Now that we have these, we need to create some data and render it. Go back to the code behind and adjust the Loaded event as follows:
List<Trade> _trades = new List<Trade>();

private void SimpleAnnotationsLoaded(object sender, RoutedEventArgs e)
{
    // Create some data to display
    var dataset = new DataSeriesSet<DateTime, double>();
    var series = dataset.AddSeries();
    var prices = DataManager.Instance.GetPriceData("INDU_Daily");
    series.Append(prices.TimeData, prices.OpenData, prices.HighData,
                  prices.LowData, prices.CloseData);

    // NEW CODE BELOW THIS LINE

    // Create some random trades from the data
    var random = new Random();
    for(int i = 0; i < prices.Count; i++)
    {
        if (random.NextDouble() < 0.8) continue;

        bool isLongTrade = random.NextDouble() > 0.5;
        var trade = new Trade()
                        {
                            BuySell = isLongTrade ? BuySell.Buy : BuySell.Sell,
                            DealPrice = isLongTrade ? prices[i].Low : prices[i].High,
                            TradeDate = prices[i].DateTime,
                        };

        _trades.Add(trade);
    }

    sciChart.DataSet = dataset;
}
This code creates some Trade instances and stores them in a list. Now we’re going to render them when SciChart renders:
private void SciChartSurfaceRendered(object sender, EventArgs e)
{
    // On scichart rendered, we need to position the markers
    sciChart.ModifierSurface.Clear();

    // Get the coordinate calculators off the axes - valid for the current render pass
    var yCoordCalculator = sciChart.YAxis.GetCurrentCoordinateCalculator();
    var xCoordCalculator = sciChart.XAxis.GetCurrentCoordinateCalculator();

    foreach(var trade in _trades)
    {
        // Take the xaml defined trade marker and clone it depending on trade side
        var path = trade.BuySell == BuySell.Buy ? (Path)Resources["LongMarker"] : (Path)Resources["ShortMarker"];
        path = ClonePath(path);

        // Compute pixel coords by converting data values to pixels
        double yCoord = yCoordCalculator.GetCoordinate(trade.DealPrice);
        double xCoord = xCoordCalculator.GetCoordinate(trade.TradeDate);

        // Ignore anything out of view
        if (yCoord < 0 || yCoord > sciChart.ModifierSurface.Height ||
            xCoord < 0 || xCoord > sciChart.ModifierSurface.Width)
            continue;

        // Position and add the marker to the canvas
        Canvas.SetTop(path, yCoord);
        Canvas.SetLeft(path, xCoord);
        sciChart.ModifierSurface.Children.Add(path);
    }
}
Breaking this code down as follows:
On each render, the ModifierSurface, a canvas which is overlaid on top of the chart, is cleared.
Next, we get the current X and Y coordinate calculators. These are helper classes gauranteed to be valid only for the current render pass, which can be used to convert Pixels to Data coordinates and vice versa.
Finally, we iterate over the previously stored trades, converting their DealPrice and TradeDate into X,Y pixel coordinates and add a marker to the ModifierSurface. The last piece of the puzzle is the Path’s we created in Xaml are cloned at this point so we get a new instance every time to add to the canvas:
// This was just a way of new'ing up a path object that has been defined in Xaml, by cloning a resource
private Path ClonePath(Path path)
{
string xaml = XamlWriter.Save(path);
using (System.IO.MemoryStream stream = new System.IO.MemoryStream(xaml.Length))
{
using (System.IO.StreamWriter sw = new System.IO.StreamWriter(stream))
{
sw.Write(xaml);
sw.Flush();
stream.Seek(0, System.IO.SeekOrigin.Begin);
Path clonePath = XamlReader.Load(stream) as Path;
return clonePath;
}
}
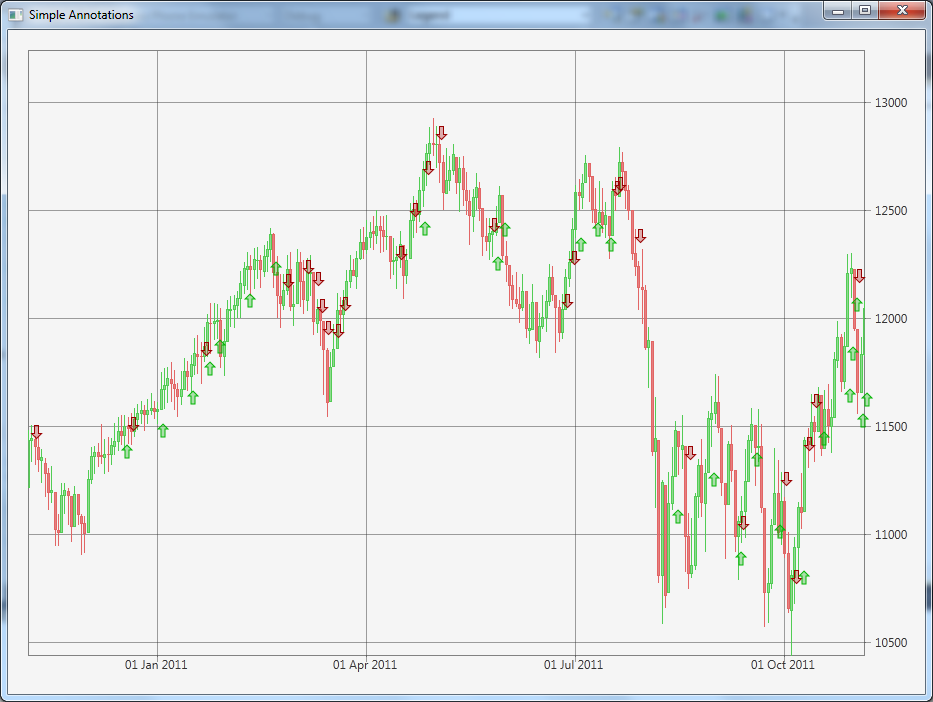
}That’s it! When you run your application you should see something like this:
To help you reproduce the above tutorial we have attached the SimpleAnnotations.xaml and Trade.cs files here.
You will need the latest version of SciChart installed. If you have any questions or comments, please feel free to leave them below!
Related Posts
![]()
Queens Award for Innovation
Proud winners of the Queens Award for Innovation, 2019. Awarded on account of our innovative graphics engine which underpins the SciChart library and enables our world-beating charting performance
![]()
National Business Awards
Highly Commended for Lloyds National Business Awards, 2019. Awarded on account of our innovative graphics engine and impressive customer base
![]()
National Technology Awards
Awarded “Healthcare Tech of the Year” at the 2025 National Technology Awards – a top UK recognition for breakthrough innovation in technology.

Reviews
SciChart has received hundreds of verified, 3rd party reviews