Fastest Chart Libraries for Quantitative Analysis & Quant Finance
Evaluate the fastest chart libraries for quantitative analysis to maintain stable, high-performance visual dashboards in volatile financial markets.
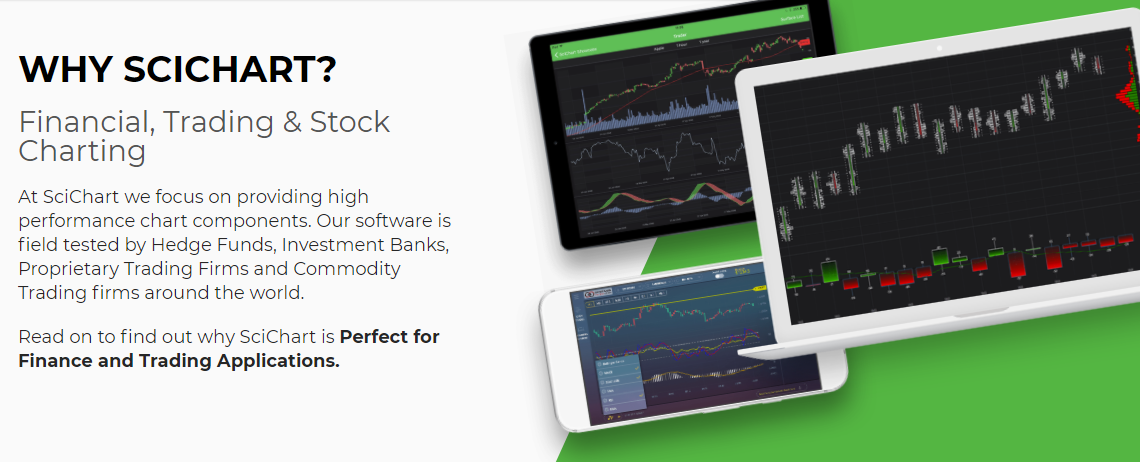
SciChart is a powerful charting and data visualisation component with many applications across sectors. One of these is finance & trading. With the recent cryptocurrency boom and Robinhood trading phenomenon, we see more and more popularity for building finance & trading applications using SciChart.
We often get asked ‘Does SciChart support technical indicators?’
SciTrader, our Cryptocurrency Trading App is now released!
“Utilising SciChart’s Award-Winning iOS & Android Chart Library, the SciTrader App provides an innovative altcoin heatmap, a live cryptocurrency watchlist and rich interactive trading charts with realtime data updates, technical indicators, zooming & panning and more …” [learn more]
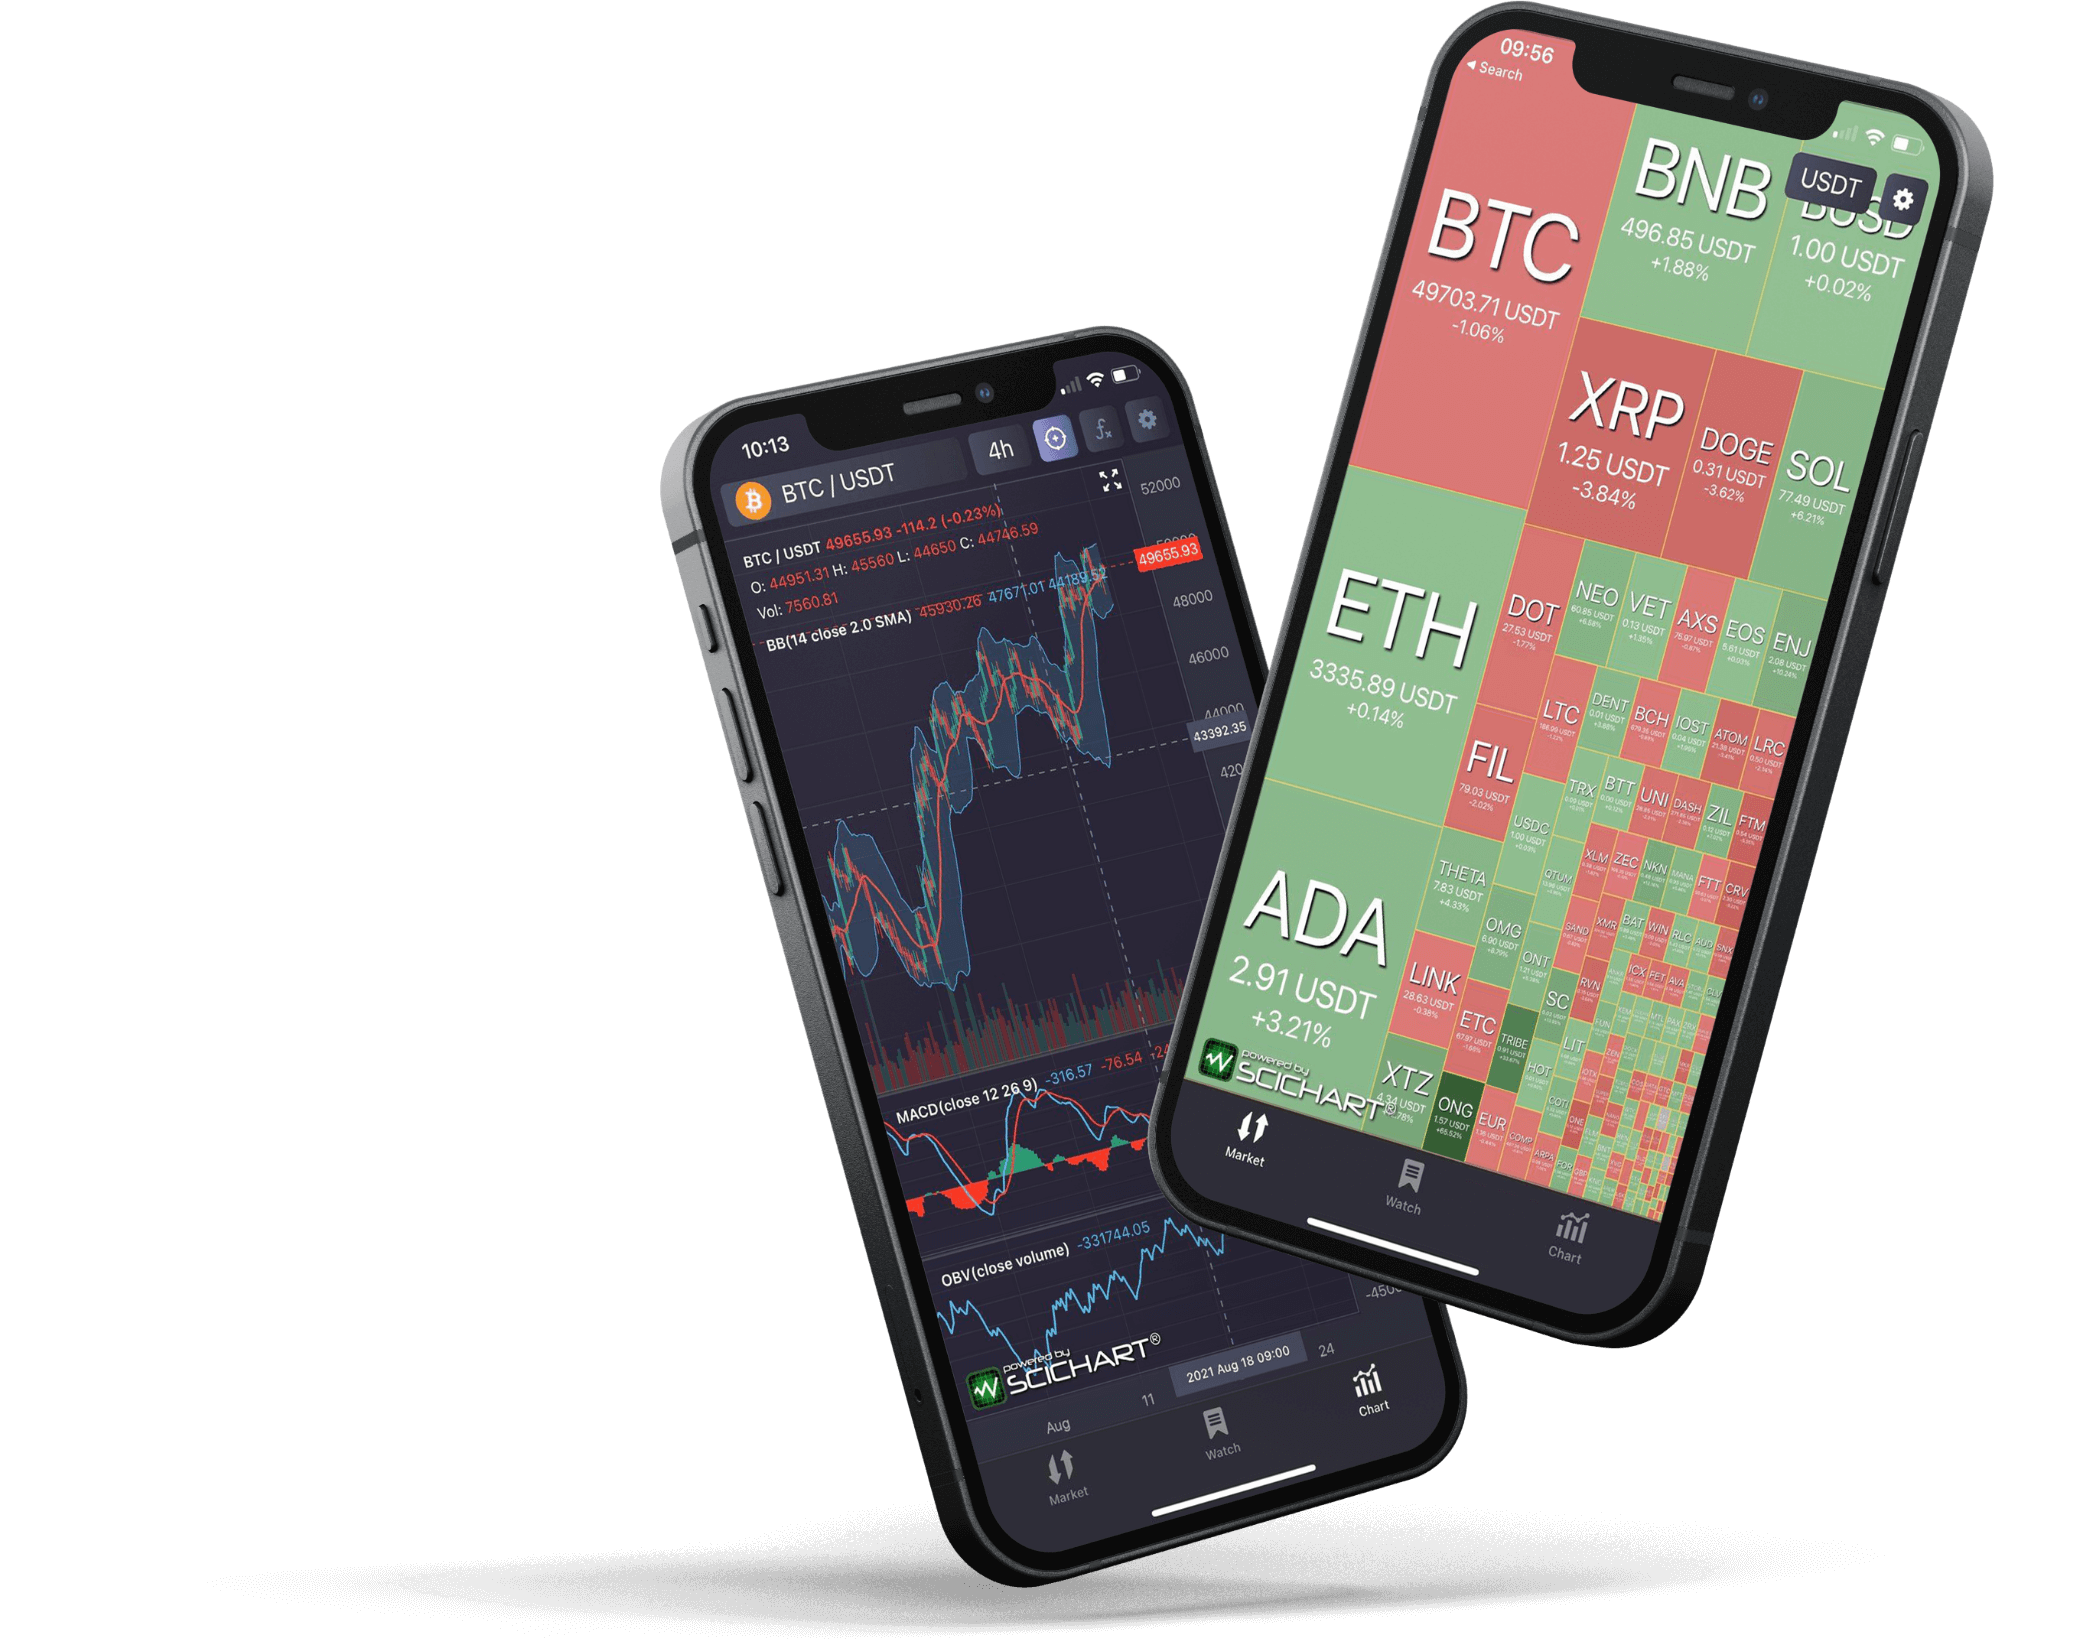
We are packaging SciTrader as a FREE app on iOS and Android showcasing the speed & power of the SciChart SDK for realtime, interactive trading charts.
A Javascript version of the SciTrader app will also be published soon, as well as the SciTrader SDK – a powerful SDK allowing you to include trading charts with automatic data management, technical indicators, zooming & panning and more into native iOS (Swift), Android (Kotlin) and JavaScript browser applications
It is a common feature request and there are open-source TA indicator libraries out there that you can integrate to SciChart. However, creating a framework or financial chart component with editable settings and user interactivity is a big piece of work.
So, we decided to present SciChart’s capabilities by doing this work for you, by creating a financial charting component for use when developing mobile iOS/Android cryptocurrency or stock trading applications.
Here’s a video below where I talk about a demo application we’ve created, called SciTrader, which uses this new mobile financial charting component:
We’ve created a financial charting component which has the following features that trading app developers and users expect to see.
This component is in development now and is in preview. Supporting Swift/Kotlin it is developed for mobile platforms, but we will be adding a JavaScript version soon.
It is likely that we will have something ready for sale in the next couple of months. We are also able to accept orders now for consultancy work for integration of our component to your application. Contact sales if this is of interest.
We’ve taken the work out of building an iOS or Android mobile trading application by building a framework for managing indicators and financial charting.
Here are some of the features we have created so far.
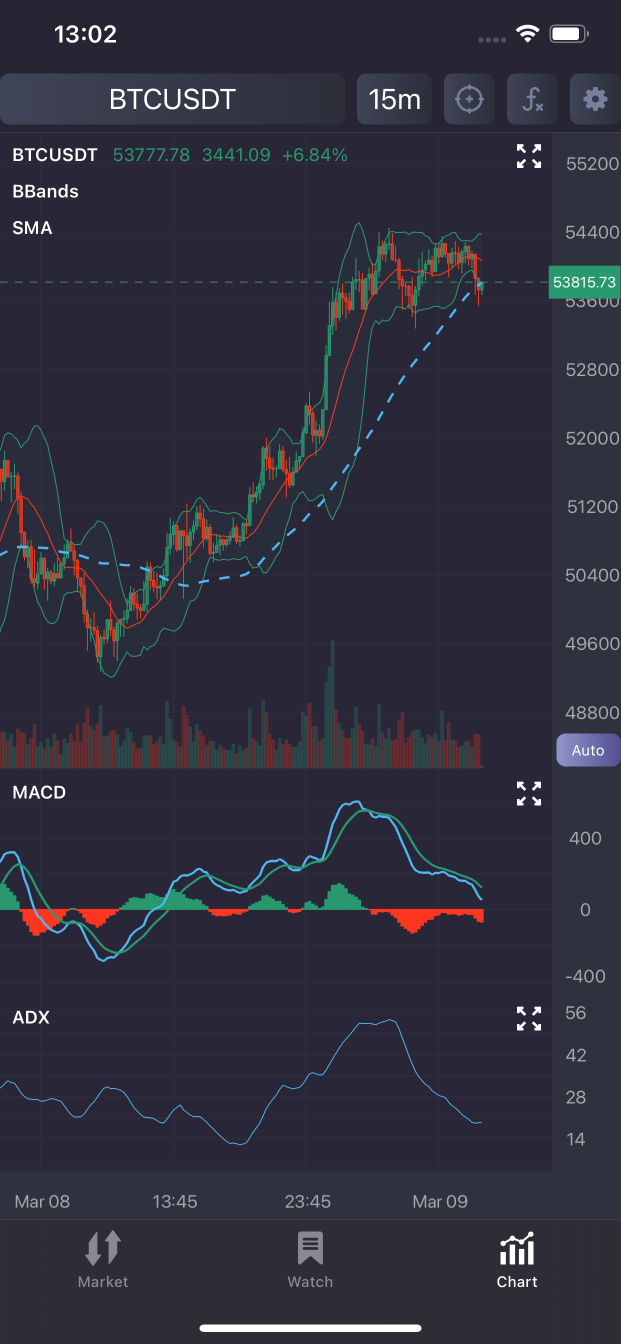
SciChart’s financial charting component supports over 20 technical indicators, with a possibilty to add more.
Indicators we support include:
We’ve built a framework for incorporating technical indicators and piping data from an abitrary data-source (which can be exchange, or local store of data), through to indicators which can then be rendered on the chart. Indicators can be placed on indicators e.g. Moving Average on RSI. This is quite a bit of work and very valuable on it’s own. If you are considering to build a trading app with SciChart, then get in contact with our sales team, as we can help you get to market faster.
This framework or architecture allows for custom indicators to be added or for the list above to be modified in order to build fully-featured trading applications using our flexible, powerful, iOS/Android Chart library.
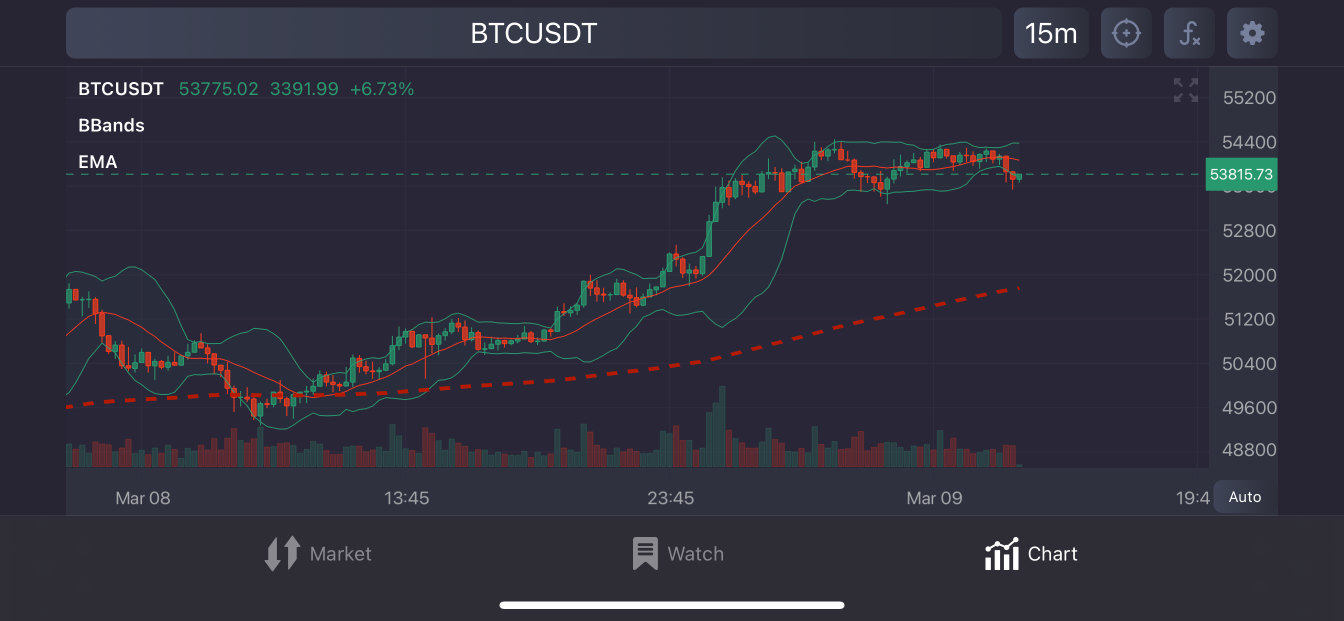
SciChart supports linked multi-pane stock charts, and so does our financial chart component.
We’ve built into a demo app the ability to change instrument by selecting a dropdown. In this case our instrument list are cryptocurrencies or coins from the Binance exchange. Our code can be adapted to integrate to any exchange or datasource.
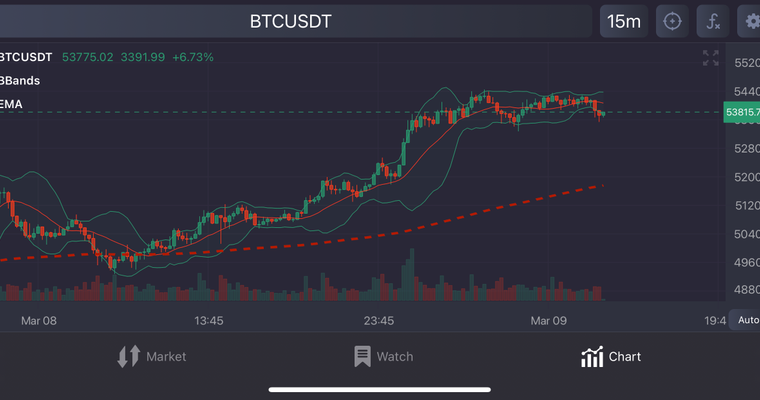
In our demo app you can change timeframe, e.g. 1-minute, 5-minute, 15-minute, hourly, 4-hour or daily charts are all supported and more. Again, we are using historical data and live market data from Binance, but any datasource can be integrated.
Our financial charting component supports rich zooming, panning and scaling via touch. Check out the short video below showing how it is possible to pinch zoom the main chart on an iOS or Android device, scale the axis via panning or pan the main chart. All chart panes move in unison as they have been synchronized using our multi-chart API.
We’ve developed a custom cursor and active legend for our Financial Chart component. This is using our ChartModifier API – part of the SciChart iOS/Android SDK – which allows you to code custom behaviours which respond to touch gestures.
The legend is placed in the top left of each chart and shows the values of the price series and indicator series under the cursor. The cursor may be positioned with touch and enabled or disabled via a button on the UI.
SciChart’s financial chart framework supports dynamic changing of indicator properties, which could include Moving Average length or RSI length, as well as indicator styles such as line width, line dash and line or fill colour. Watch the short video below where you can us modifying the indicator style and color dynamically through the app.
In our demo we showcase connection to Binance cryptocurrency exchange for live and historical market data. New prices are sent via Websocket to our demo application and the candlestick chart and all indicators update. This datasource can be swapped out and theoretically we can modify the code to fit whatever datasource you wish, be it your own exchange as a broker, or a custom datafeed to stock or cryptocurrency exchanges.
SciChart is a high-performance chart library/SDK which has plenty of power to draw lots of series, markers and chart elements without introducing slowdown into your app.
So what do we plan to do with this?
We plan to continue developing this financial chart component, adding the ability to draw trendlines, add text using SciChart’s rich Annotations API. We also intend to add drawing tools such as Fibonacci Retracement and other popular financial drawings to the chart.
We plan to build a version using our JavaScript charts which will support browser-based or electron applications written in JavaScript or TypeScript.
We plan to ship the financial chart component as an add-on or plugin to SciChart and we will also be available to work with your teams integrating to your applications on mobile or javascript if you require.
If you are running a brokerage, cryptocurrency or stock exchange, are a proprietary trading firm, hedge fund or CFD/spread bet provider and you are interested in SciChart for your trading apps, get in touch with sales and tell us your requirements.
We would love to hear from you and show how we can help you get your product to market fast!
SciChart is a very capable chart component. With support for multi-platform including Windows (WPF, C#), native iOS & Android, Mac OSX and JavaScript Charts with our powerful, fast SciChart.js component, there’s a myriad of applications you can create from financial, to scientific, medical and business dashboarding apps.
Our customers (exchanges, brokerages and banks), have used our award-winning chart software to create desktop financial & trading apps, as well as mobile trading apps and we are working to add features for the fintech sector to make SciChart more appealing to this market.
We ourselves are able to offer consultancy with our experts in finance, trading apps as well as high performance data-visualisation. If you wish us to develop an application or consult on the best way to use SciChart then contact sales, we would be very pleased to help!
Recent Blogs
![]()
Queens Award for Innovation
Proud winners of the Queens Award for Innovation, 2019. Awarded on account of our innovative graphics engine which underpins the SciChart library and enables our world-beating charting performance
![]()
National Business Awards
Highly Commended for Lloyds National Business Awards, 2019. Awarded on account of our innovative graphics engine and impressive customer base
![]()
National Technology Awards
Awarded “Healthcare Tech of the Year” at the 2025 National Technology Awards – a top UK recognition for breakthrough innovation in technology.

Reviews
SciChart has received hundreds of verified, 3rd party reviews