At SciChart.js we’ve blogged several times on the incredible speed and performance of our JavaScript Chart library. For example, this post from last year showcases SciChat.js drawing 10 million data-points in under 25 milliseconds. Another blog demonstrates how SciChart.js transforms trading performance: as we have the only JS chart framework able to load the entire history of Bitcoin in a 1-minute candlestick chart in javascript.
However, some of our users require more than just a fast single chart. Here is a challenging requirement which was given to us by a customer of SciChart.js:
Customer Requirement – JS Dashboards
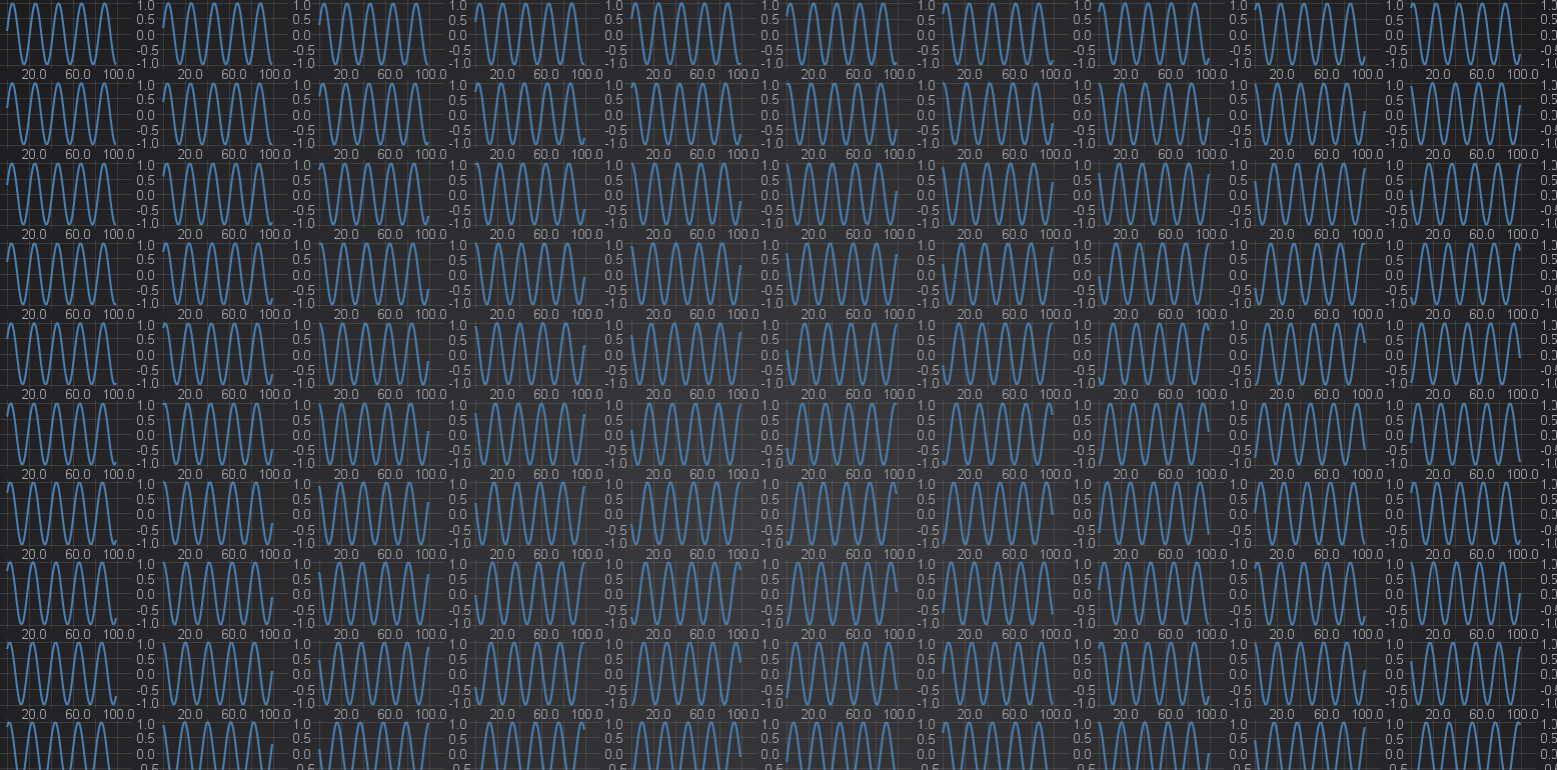
Customer A wanted a grid of up to 100 charts, each chart could have tens of thousands of datapoints. They needed to be interactive with synchronised x axes, which means that when any chart is zoomed/panned, every chart has to redraw. Text labels had to be visible for all charts and dynamically update as the chart is zoomed.
A dashboard with 100 charts look like this:

The stats / requirements are:
- 100 javascript charts in a single browser window
- Each chart with 60,000+ datapoints (total 6 million points)
- 200 axis each with 5 labels per axis
- Total of 1,000 text labels and 6 million datapoints
- This had to render at interactive speeds (30 FPS or better)
Our first attempt
Our first attempt at this used our built-in API to synchronise multiple JavaScript charts. This worked, but the performance wasn’t good enough. Only 1-2 FPS for 100 charts. We had to improve.
Improving text rendering speed in JavaScript
A major bottleneck we identified was the text rendering. With 1,000s of text labels on screen for this example the time just to draw the text was significant. To solve this, we implemented a novel native text rendering algorithm within our WebGL/WebAssembly graphics engine. This has been built into SciChart.js and includes full font support, including for shaped fonts like Arabic, Korean, Japanese and right to left text. This improved performance by a factor of 4 for the 100 chart dashboard scenario.
Unifying Rendering of multiple charts
The next bottleneck is that by default, SciChart.js uses WebGL context sharing to get around the limit of 16 WebGL contexts per browser page. This has some extra overhead associated with drawing which is noticeable as the number of charts adds up. You can turn this off, opting for one WebGL context per chart (see documentation here), but then you’ll hit a hard limit of 16 charts on screen.
So, what if we combined the best of both worlds?
Our solution was to build an entirely new API called the SubCharts API which allows you to add multiple SciChartSurfaces to an existing chart surface. Our rendering engine then batches draw calls for all these charts into one. This technique doubled performance again, so we are now up to 8-10 times faster than before.
Final results
Below are the final results in table and chart form. With these enhancements, SciChart.js is able to render over 100 charts in a 10×10 dashboard, each with tens of thousands of data-points and refresh or update at 30 FPS. Even 192 charts is possible using these new techniques, allowing massive dashboards with hundreds of charts in a browser.
| # Charts | v2.x FPS | Native Text FPS | Subcharts FPS | Speed up (%) |
|---|---|---|---|---|
| 4 Charts | 58.9 | 60 | 60 | +2% |
| 8 Charts | 49.9 | 59.9 | 60 | +20% |
| 16 Charts | 25.9 | 59.9 | 60 | +131% |
| 32 Charts | 13.4 | 47.4 | 60 | +347% |
| 64 Charts | 6.6 | 24.5 | 46.6 | +606% |
| 128 Charts | 3.4 | 13.0 | 28.9 | +789% |
| 192 Charts | – | 8.3 | 17 | INF |
Here are the performance results in chart form. You can see that with these improvements SciChart.js can greatly improve the overall responsiveness and interactivity of dashboards with hundreds of JavaScript charts.

When will these improvements be available?
The SubCharts API which allows you to place charts in charts will be available as part of the SciChart.js v2.3 release, due later this year. This release will also include native text enhancements for better text label drawing performance and text labels on datapoints.
About SciChart: High Performance Realtime Charts
SciChart provides high performance real–time chart components on the WPF (Windows), iOS, Android and JavaScript platforms. Our software is used by companies that require the fastest possible 2D & 3D charts such as Formula One, research & scientific innovation, medical companies and more. So, when they ask us to push the boundaries of performance even further, we spare no expense!
If you have a question about what SciChart’s WebGL / WebAssembly Charts can offer you, or if you would like to get a quote, please contact us. Our friendly, helpful team will be glad to help!
Start using SciChart.js Today
SciChart.js is now available with a FREE community edition (no trial, sign-up or credit card required) where you can try out the library commercially or use it in a non-commercial application. If you have a question, or would like to give feedback, contact us.
Recent Blogs
