At SciChart we like to push the boundaries of performance to meet the needs of our customers creating cutting-edge applications.
Our software is used by companies that require the fastest possible 2D & 3D charts such as Formula One, research & scientific innovation, medical companies and more. So, when they ask us to push the boundaries of performance even further, we spare no expense!
Previously we wrote about SciChart.js, our fast JavaScript Chart library which could load 1 Million datapoints in under 15ms. This is a pretty cool feat but what if I told you with our cutting-edge technology SciChart can do even more?

By utilising SciChart’s award-winning C++ graphics engine, cross-compiled into WebAssembly and WebGL, we’ve enabled further optimisations in our JavaScript charts.
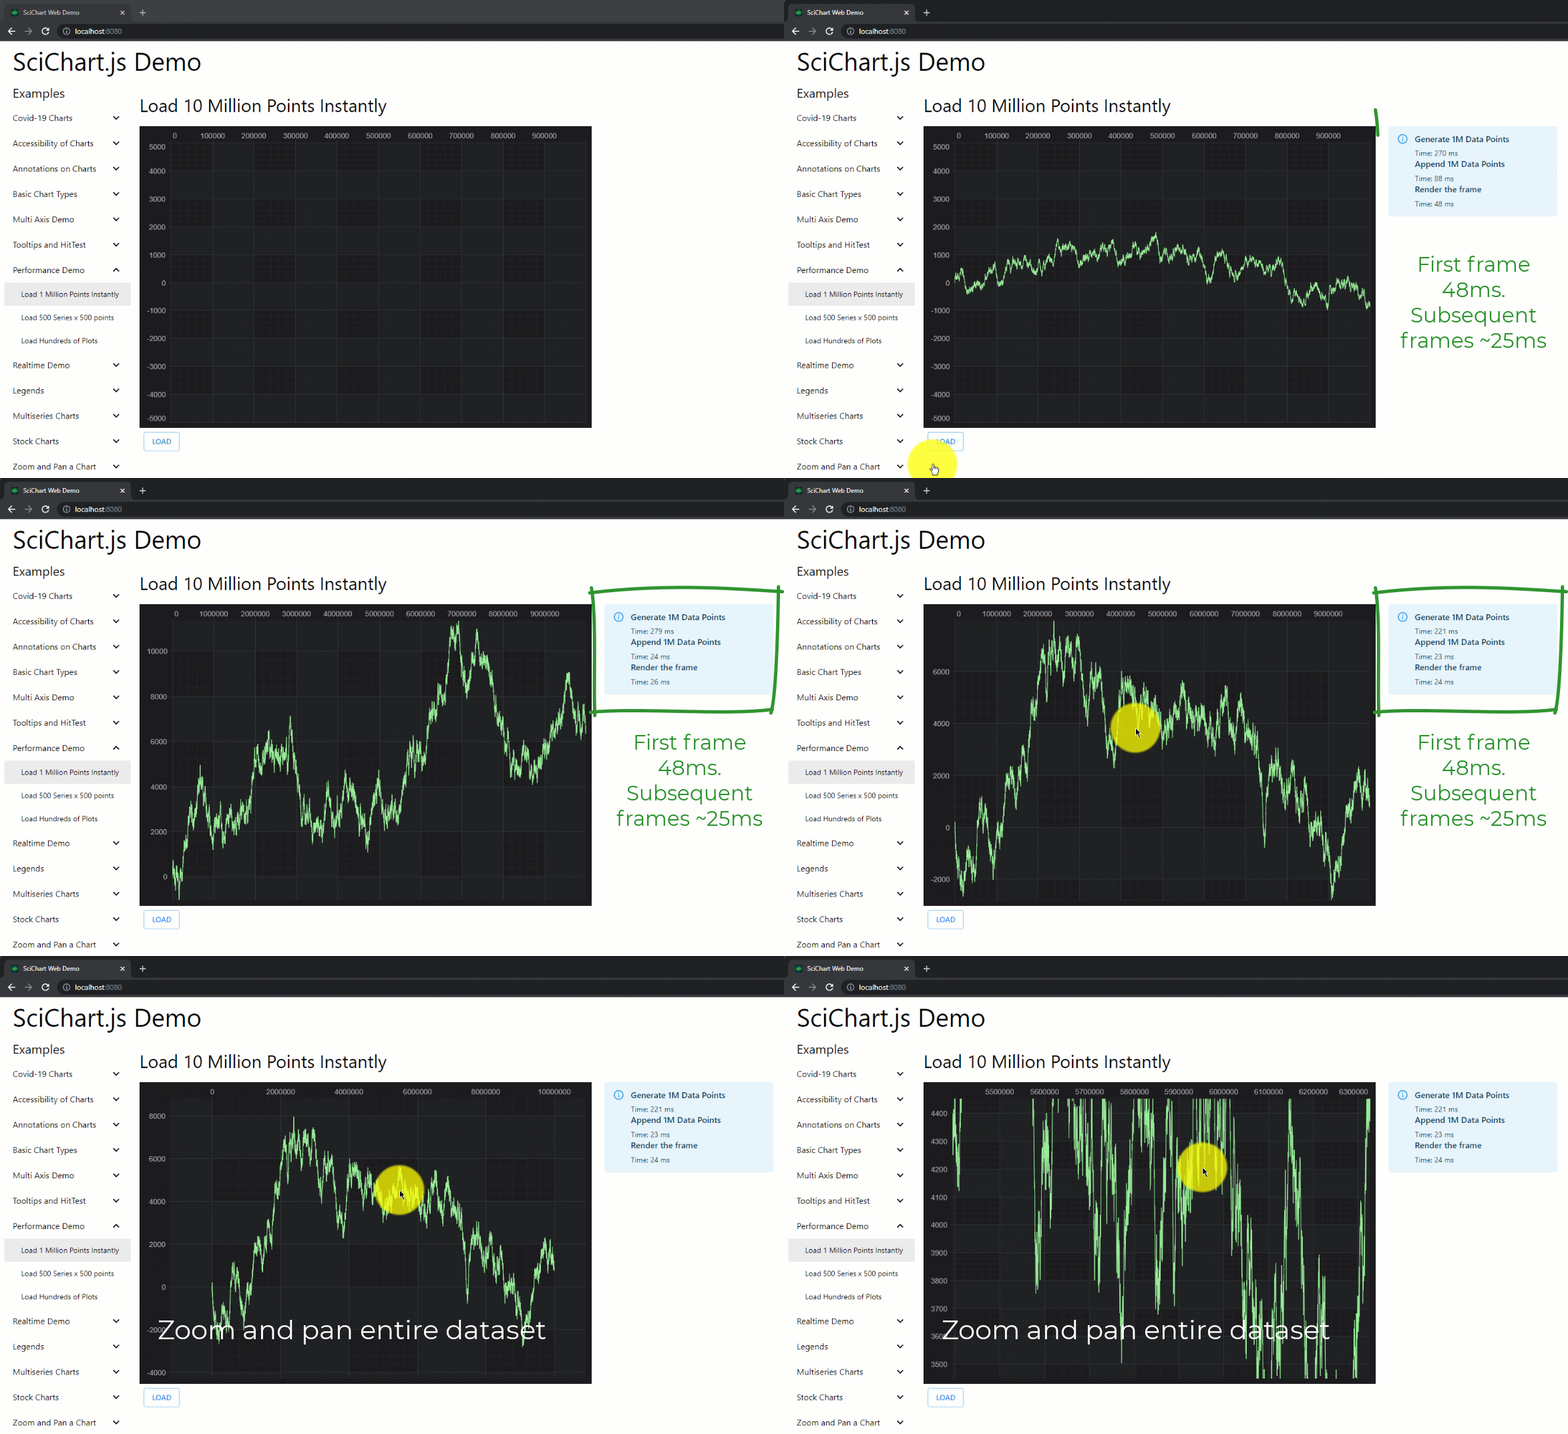
With our latest optimisations (internal build) SciChart.js can now render 10,000,000 datapoints (10 Million Datapoints) in under 25 milliseconds.
Here’s a quick video:
10 Million points plotted in 25 ms 🤯 A testament to our teams dedication to the fastest possible JavaScript chart control!
Pushing the Boundaries of JavaScript DataVisualization
Well that’s awesome but can we do any more?
Theoretically we can. SciChart’s proprietary technology allows for ultra-large datasets in charts & graphs, making us perfect for Big-data and demanding real-time charting applications. We currently hold the unofficial record for the largest number of datapoints visualised in a Windows chart control at 64 Billion datapoints.
Due to our innovative tech stack where we share a vast and thoroughly road-tested C++ code across platforms, plus our team of experts in performance optimisation, SciChart.js can theoretically be made to draw ultra large datasets up to billions of datapoints. But is that what you need in your browser or electron applications? If so, get in touch with us and let’s discuss.
If you have a challenging or impossible data-visualization project, then send us an email and we will do our best to help!
About SciChart: High Performance Realtime Charts
SciChart provides high performance real–time chart components on the WPF (Windows), iOS, Android and JavaScript platforms. It is our goal to create the best cross-platform Native WPF, iOS, Android and JavaScript 2D & 3D Charts in the world, focusing on performance, developer productivity, ease of use, depth of features and enterprise-grade tech support.
If you have a question about what SciChart’s WebGL / WebAssembly Charts can offer you, or if you would like to get a quote, please contact us. Our friendly, helpful support team will be glad to help!
SciChart.js JavaScript Chart Library
Recent Blogs
