SciChart.js v6 in Alpha – WebGPU, Incredible Performance Gains and more
Our team has been working hard on continued R&D with SciChart.js – High Performance JavaScript Charts – and today we’d […]
SciChart.js, our Ultra-High Performance JavaScript Chart library is now released!
“With WebAssembly and WebGL hardware acceleration and an optimized render pipeline, SciChart provides extremely fast JavaScript charts capable of drawing millions of data-points in realtime …” [read more]
If you haven’t read already, at SciChart we’re developing a Javascript chart component which specialises in fast 2D/3D charts & graphs for your Javascript, Typescript, React, Angular and possibly even Blazor applications. SciChart already exists on other platforms, such as Windows (WPF), iOS and Android and boasts outstanding performance: able to draw millions of data-points in real-time on mobile, or even plot billions of data-points in real-time on Windows. This opens up a whole host of previously impossible applications, such as: visualising real-time ECG waveforms on a mobile device, big data analysis of telemetry on Windows PCs, or field lidar-visualisation on an iPad.
So what about Javascript? Can we match the incredible performance of SciChart on this platform? Turns out we can! We’ve taken our 3D engine – the result of years of Research and Development and compiled it to WebAssembly with WebGL. In a previous post we talked about our progress toward SciChart.js and showcased some real-time charts, and also showcased some Javascript 3D data-visualisation that we’re building for web browsers.
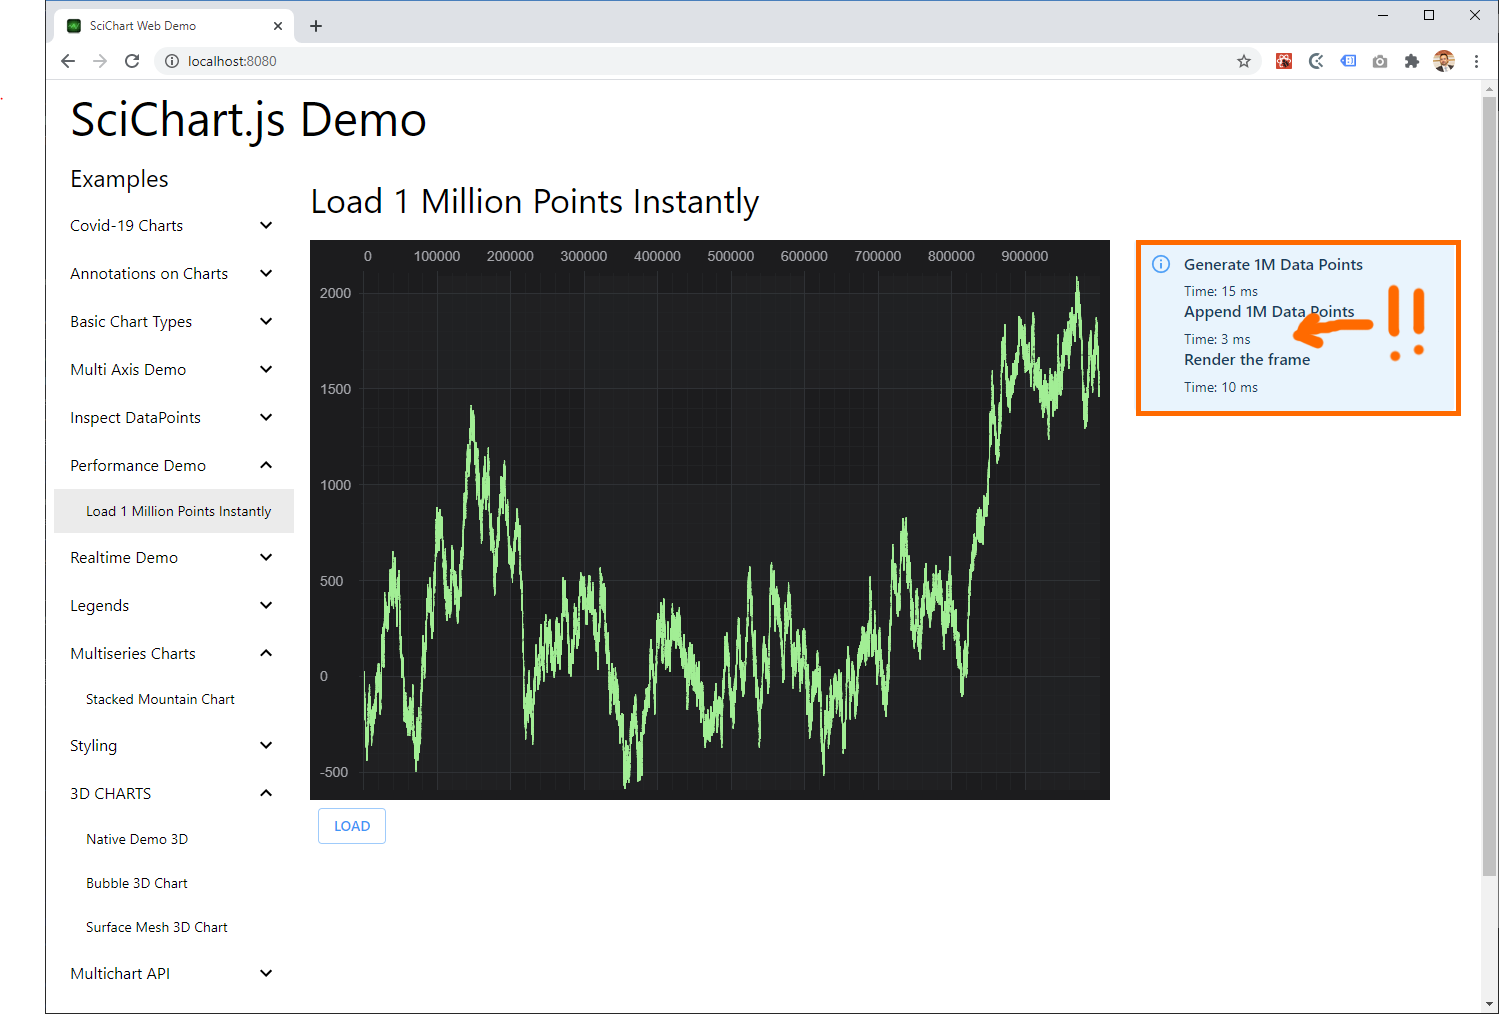
In this post I’m going to show you a very quick demo of the speed & performance of SciChart for Javascript: loading 1 million data-points in under 15 milliseconds.
This is a simple test which shows how fast SciChart.js is at loading, processing and drawing data. Results below!
SciChart.js is still in development, and we don’t have a version released for testing just yet, but we wanted to share the source-code for the example so you can see how we’re logging time.
First of all we have to create the SciChartSurface. At the moment in the API there is a helper function which initializes and returns a webassembly context. We might change this before the first release. Then there is code to add XAxis, YAxis and set RenderableSeries. SciChart has the concept of separating out RenderableSeries and DataSeries so you can update an object in real-time and change how it draws or renders separately.
// Create the WebAssembly context and SciChartSurface
const { wasmContext, sciChartSurface } = await createSciChartSurface(divElementId, WIDTH, HEIGHT);

// Apply a theme
sciChartSurface.applyTheme(new SciChartJSDarkTheme());

// Create an XAxis and add to the chart
const xAxis = new NumericAxis(wasmContext, {
    axisAlignment: EAxisAlignment.Top,
    visibleRange: new NumberRange(0, 1000000),
    autoRange: EAutoRange.Never
});
sciChartSurface.xAxes.add(xAxis);
// Create a YAxis and add to the chart
const yAxis = new NumericAxis(wasmContext, {
    axisAlignment: EAxisAlignment.Left,
    visibleRange: new NumberRange(-5000, 5000),
    autoRange: EAutoRange.Never
});
sciChartSurface.yAxes.add(yAxis);

// Create a DataSeries of Xy data
const dataSeries = new XyDataSeries(wasmContext);
// Create the Line series and set properties
const lineSeries = new FastLineRenderableSeries(wasmContext, { dataSeries, strokeThickness: 2 });
// Add the line series to the chart
sciChartSurface.renderableSeries.add(lineSeries);
lineSeries.stroke = "#42b649";

// Set interactivity modifiers: Zoom, pan, mousewheel zoom
sciChartSurface.chartModifiers.add(
    new ZoomExtentsModifier(),
    new ZoomPanModifier(),
    new MouseWheelZoomModifier());
This code creates a SciChartSurface, adds the axis and renders the empty chart on the screen. The output so far can be seen below:
Next we add a button click handler to load the data and perform the performance test. The click handler code looks like this:
// Buttons for chart
const loadPoints = () => {
    console.log("load points");

    // Clear state
    dataSeries.clear();
    const newTimeSpans: TTimeSpan[] = [];

    // Start counting Points generation time
    const generateTimestamp = Date.now();

    // Generate 1,000,000 points as a Random walk
    const POINTS = 1000000;
    const xValues = new Array(POINTS);
    const yValues = new Array(POINTS);
    let prevYValue = 0;
    for (let i = 0; i < POINTS; i++) {
        const curYValue = Math.random() * 10 - 5;
        xValues[i] = i;
        yValues[i] = prevYValue + curYValue;
        prevYValue += curYValue;
    }

    // Log time: Generating 1M data points
    newTimeSpans.push({
        title: "Generate 1M Data Points",
        durationMs: Date.now() - generateTimestamp
    });

    // Start counting data append time
    const appendTimestamp = Date.now();
    dataSeries.appendRange(xValues, yValues);

    // Log time: Appending data to SciCHart
    newTimeSpans.push({
        title: "Append 1M Data Points",
        durationMs: Date.now() - appendTimestamp
    });

    // Subscribe to sciChartSurface.rendered event,
    // and calculate time duration for drawing
    const firstFrameTimestamp = Date.now();
    let frameIndex: number = 0;
    // We're going to measure 10 frames
    const numberFramesToMeasure: number = 10;
    let nextFramesTimestamp: number;
    const handler = () => {
        if (frameIndex === 0) {
            newTimeSpans.push({
                title: "Render the first frame",
                durationMs: Date.now() - firstFrameTimestamp
            });
            nextFramesTimestamp = Date.now();
            // sciChartSurface.zoomExtents();
        } else if (frameIndex === numberFramesToMeasure + 1) {
            newTimeSpans.push({
                title: "Render next frames average",
                durationMs: (Date.now() - nextFramesTimestamp) / numberFramesToMeasure
            });

            // After 10 frames update the UI and unsubscribe from sciChartSurface.rendered
            updateTimeSpans(newTimeSpans);
            sciChartSurface.rendered.unsubscribe(handler);
        }
        // Trigger a redraw immediately
        setTimeout(sciChartSurface.invalidateElement, 0);
        // Increment frame index
        frameIndex++;
    };
    sciChartSurface.rendered.subscribe(handler);
};

document.getElementById("loadPoints").addEventListener("click", loadPoints);
When we click the button the code above is going to create a 1-million point (x,y values) of a Random walk, and then set it into SciChart.js using dataSeries.appendRange(xValues, yValues). Finally we use the SciChartSurface.rendered event (callback) to measure actual time between draws and calculate the time to render the first frame, and subsequent 10 frames to compute an average.
Here are the results!

What’s more, this data is all there. We haven’t down sampled it or pre-processed it at all. It’s not a static image and it’s not server-side rendered. You can actually zoom and pan right into the chart and see all the data. Take a look:
But wait! 50-70 milliseconds is pretty good but can it go any further? Turns out that it can. When I did the above test I forgot to enable Emscripten compiler options for maximum performance 😀.
There’s a rundown on what the different compiler options do at the Emscripten compiler documentation. For the following test I enabled flag -O3 Maximum Speed optimisation. This also reduces wasm / WebAssembly file size also making it blazing fast for use on the web. Here is the result:
Wow!! 🚀🚀 That’s just incredible. One million points appended to the chart, and rendered in 13 milliseconds when full optimisations are enabled. There is not a Javascript chart library in the world that can match this performance. The speed, power and performance of SciChat with WebAssembly/WebGL is just unmatched…
SciChart.js in the test above is able to draw add and draw million data-points in line charts in under 15 milliseconds, with a redraw time as fast as 10ms once the data has been loaded. This incredible performance of SciChart.js opens up a whole host of applications that were previously impossible, now made possible.
For example:
All the above were previously impossible projects, but will be made possible by SciChart.js – High Performance Realtime Javascript & React Charts.
SciChart.js – our GPU Accelerated 2D/3D JavaScript Chart has now been released! In fact, we have just released a version 2 (November 2021) which is a Huge upgrade to v1.
If you want to learn more about SciChart.js or start a trial, or test drive the features by looking at our Js Charts Demo, click the link below.
SciChart.js JavaScript Chart Library
SciChart provides high performance realtime chart components on the WPF (Windows), iOS, Android and JavaScript platforms. It is our goal to create the best cross-platform Native WPF, iOS, Android and JavaScript 2D & 3D Charts in the world, focusing on performance, developer productivity, ease of use, depth of features and enterprise-grade tech support.
If you have a question about what SciChart’s WebGL / WebAssembly Charts can offer you, or if you would like to get a quote, please contact us. Our friendly, helpful support team will be glad to help!
Recent Blogs
![]()
Queens Award for Innovation
Proud winners of the Queens Award for Innovation, 2019. Awarded on account of our innovative graphics engine which underpins the SciChart library and enables our world-beating charting performance
![]()
National Business Awards
Highly Commended for Lloyds National Business Awards, 2019. Awarded on account of our innovative graphics engine and impressive customer base
![]()
National Technology Awards
Awarded “Healthcare Tech of the Year” at the 2025 National Technology Awards – a top UK recognition for breakthrough innovation in technology.

Reviews
SciChart has received hundreds of verified, 3rd party reviews