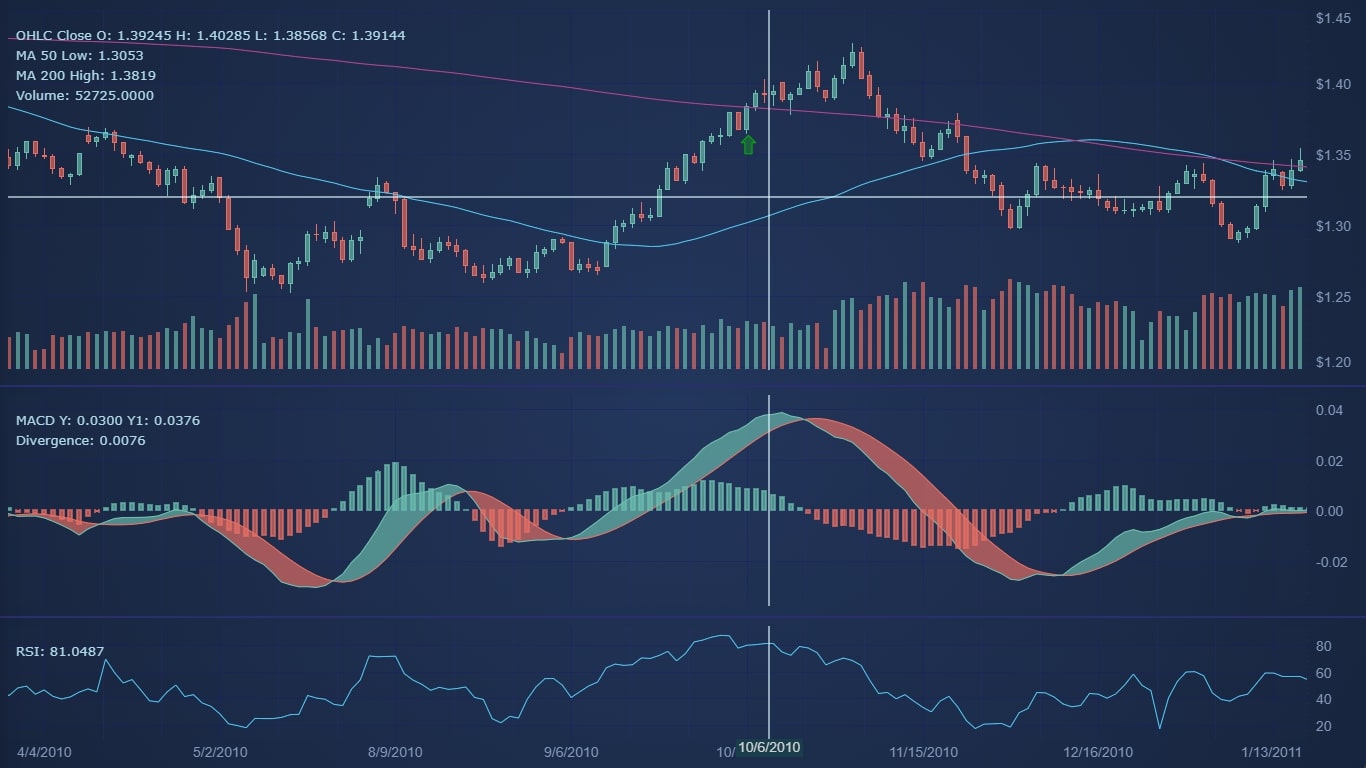
Humans absorb visual information a lot quicker than reading through heavy sets of data or text. In the trading and stock markets, financial charts help to communicate changes and correlations at a glance. However, financial data can be complex to manage. For many web app owners who are already leveraging the use of data charts, you may want to know if there’s a way to display more complex data sets. Displaying the data might not be the problem – but showcasing it in a succinct way is easier said than done. SciChart makes building financial charts that much easier, and offers the fastest possible performance. Find out how you can give your financial JavaScript charts a boost with SciChart in our informative guide.
What are the best examples of JavaScript financial charts?
Watch our informative video below showcasing some of the best JavaScript financial charts and their specific use cases. These are the top 5 most popular charts used for real-world trading and financial applications around the world.
JavaScript financial chart example uses
JavaScript financial charts are a great way to visually track all kinds of financial, trading and stock metrics, including budgets, expenses, cash flow, liquidity and others. It’s one of the most effective ways to share a business or financial market outlook over a given period of time.
Performance analysis – Financial charts will help you analyse your financial insights and business situation better, leading to more informed decisions. It’s also worth using charts to show product value over a set period of time.
Cost vs revenue analysis – Check the relationship between expenses and profit.
Set better goals – With interactive financial charts, you’ll be able to set valuable financial KPIs for your business leading to growth and goal success.
Inventory audits – Show positive and negative changes in quantities.
Avoid mistakes and save time – Displaying your financial data in a visual, interactive chart will help you avoid errors and manual pen-and-paper data analysis.
What does SciChart.JS bring to the table?
Our JavaScript financial charts add new functionality making it easy to create financial, trading and stock/forex or crypto apps for a wide range of business sectors.
- Display millions of data-points without slowdown. SciChart.js can now plot 10 Million Data Points in under 25ms. Enough to display the entire history of Bitcoin in a 1-minute chart. We’re always looking to push this further.
- Allows real-time updating of Candlestick charts without slowdown, perfect for fast moving markets.
- Synchronise several charts with interactive elements – including zoom, panning and tooltips.
- Ability to create dashboards with several charts – also known as a Multi-pane stock chart
- Even more finance-specific visualisations like Order book depth chart.
How does the design process work?
Our JavaScript chart library supports over 25 different chart types (including candlestick, ohlc (error bar), column, line and mountain (area)). With SciChart, you can easily visualise complex data sets and create dynamic, interactive web apps. They’re all responsive, meaning the chart will be legible and user-friendly whether someone is viewing on a mobile phone or laptop. You can also customise your design, selecting colours and markers that work for your design. Pairing with the right charting library, you can create high-quality financial charts, without too much effort. SciChart even supports custom themes, so you can stay 100% on brand.
- Define where on your page to draw the graph
- Define what type of graph you want to draw
- Supply data, labels, and other options
By creating interactive elements, you can help users navigate and engage with complex information and receive real-time, accurate updates. SciChart is trusted by thousands of developers worldwide and has customers in over 40 countries from sectors including investment banking and trading.
Who uses SciChart.js?
SciChart has been in business for over 10-years providing chart libraries for Windows, iOS/Android and now JavaScript. SciChart.js is used by cryptocurrency exchanges such as Deribit for visualising options profit as well as investment banks such as JP Morgan, Bank of America and Barclays Capital markets for client-facing apps.
We are able to provide an extremely flexible financial chart library supporting a wide-range of stock and trading charts such as candlesticks, ohlc (bar charts), and real-time updating financial charts, paired with expertise for providing consultancy services to help you integrate and customise SciChart.js into your JavaScript financial apps.
Discover more of our demos
If you are interested to learn more about what SciChart.js can offer in charts for finance and trading, explore our demo site or get in contact.
Start using SciChart.js Today
SciChart.js is now available with a FREE community edition (no trial, sign-up or credit card required) where you can try out the library commercially or use it in a non-commercial application. If you have a question, or would like to give feedback, contact us.
Recent Blogs
