We’re working on an enhancement to SciChart.js – our WebAssembly & WebGL Big Data JavaScript Chart library to push the boundaries of performance. Recently we blogged that an internal build of SciChart.js can now plot 10 Million Datapoints in under 25ms. That’s pretty astonishing for a JavaScript chart control! 👉
We wanted to see if SciChart could go any further and plot even bigger data (100 Million Datapoints in a Line Chart), but we hit a browser limit…
If you allocate an array of size 100,000,000 (100 Million) in JavaScript, you get a strange error: Uncaught RangeError: Invalid Array Length. Here’s the code to reproduce it. Try it out, in the developer console in Chrome:
const COUNT = 100_000_000;
const xValues = new Array(COUNT);
const yValues = new Array(COUNT);
for (let i = 0; i < COUNT; i++) {
    xValues[i] = i;
    yValues[i] = Math.sin(i * 0.000001);
}
console.log(`count: ${yValues.length}`);
This will throw an exception in JavaScript pretty consistently.

This puzzled me as I expected this to work easily, so I turned to StackOverflow to see if the JavaScript development community had an explanation. Here’s the Question & Answer.
The Limits of JavaScript Memory & Numerics in Browser
It turns out, according to this answer, JavaScript stores numbers as objects instead of double-precision (8-bytes per value). So an array of numbers is an array of objects on the heap. An object takes 50 bytes or more on the JS heap, so 100M numbers requires ~5GB of memory. The browser heap limit is 4GB so with just 100 Million numbers in an array we’re running out of memory in the browser.
We’ll never know if SciChart.js can plot 100 Million datapoints 😢 Or will we?
How WebAssembly manages memory
We’ve built our High Performance JavaScript Charts on a tried & tested C++ codebase that we also use in our WPF Charts, iOS Charts & Android Charts. This code-sharing allowed us to become truly cross-platform, truly native, and truly high performance for our 2D & 3D chart controls.
With WebAssembly we can compile our C++ codebase into a wasm module for the browser. So when you look at a SciChart.js chart you’re actually seeing our C++ graphics engine wrapped for JavaScript.
Let’s see if we can work around this memory limit in JavaScript using SciChart.js DataSeries, which uses WebAssembly.
First up the boilerplate code for setting up a SciChartSurface in SciChart.js:
// Setup the SciChartSurface
//

// Create a SciChartSurface with X,Y Axis
const { wasmContext, sciChartSurface } = await SciChartSurface.create(divElementId);
sciChartSurface.xAxes.add(new NumericAxis(wasmContext));
sciChartSurface.yAxes.add(new NumericAxis(wasmContext));

// Create a Line RenderableSeries / DataSeries pair
const dataSeries = new XyDataSeries(wasmContext);
sciChartSurface.renderableSeries.add(new FastLineRenderableSeries(wasmContext, {
   dataSeries
}));
Now appending the data. If we try 100 Million points in JavaScript arrays it fails for reasons mentioned before
// Create some x & y values in JavaScript Arrays
const COUNT = 100_000_000;
const xValues = new Array(COUNT);
const yValues = new Array(COUNT);
let prevYValue = 0;
for (let i = 0; i < COUNT; i++) {
const curYValue = Math.random() - .5;
xValues[i] = i;
    // CRASH here with Uncaught RangeError: Invalid Array Length
yValues[i] = prevYValue + curYValue;
prevYValue += curYValue;
}

// Append Js Arrays to the SciChart DataSeries.
// SciChart will draw the series
dataSeries.appendRange(xValues, yValues);
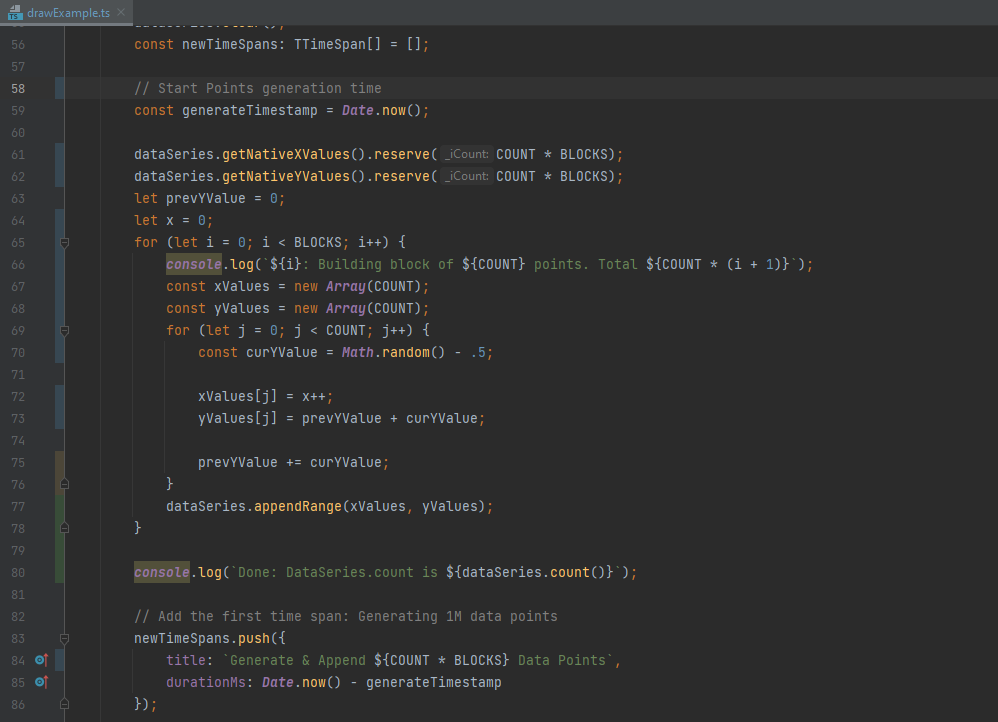
Instead of creating a 100 Million element JavaScript array, let’s create 10 blocks of 10 Million datapoints and append them to a SciChart.js DataSeries, which uses the WebAssembly heap to hold double-precision numbers:
// Using SciChart's DataSeries, reserve memory for 100 Million elements
dataSeries.getNativeXValues().reserve(100_000_000);
dataSeries.getNativeYValues().reserve(100_000_000);
let prevYValue = 0;
let x = 0;
for (let i = 0; i < 10; i++) {
console.log(`${i}: Building block. Total ${10_000_000 * (i + 1)}`);
const xValues = new Array(10_000_000);
const yValues = new Array(10_000_000);
for (let j = 0; j < BlockSize; j++) {
const curYValue = Math.random() - .5;
xValues[j] = x++;
yValues[j] = prevYValue + curYValue;
prevYValue += curYValue;
}
    // Append each 10 Million block to the DataSeries
dataSeries.appendRange(xValues, yValues);
}
Does this work? Can SciChart.js plot 100 Million datapoints using Wasm memory?
Why yes it can 😁

When Release?
We’ll be releasing an update to SciChart.js soon which will enable very big data. At the moment you can get SciChart.js version 2 from npmjs or from a CDN and render millions of datapoints with ease in the browser. SciChart enables the next generation of demanding Fintech, Medical, Scientific and Engineering applications that demand high performance. Try it out if you haven’t already!
About SciChart: High Performance Realtime Charts
SciChart provides high performance real–time chart components on the WPF (Windows), iOS, Android and JavaScript platforms. It is our goal to create the best cross-platform Native WPF, iOS, Android and JavaScript 2D & 3D Charts in the world, focusing on performance, developer productivity, ease of use, depth of features and enterprise-grade tech support.
If you have a question about what SciChart’s WebGL / WebAssembly Charts can offer you, or you have a challenging or impossible data-visualization project, then contact us and we will do our best to help!
Recent Blogs
