Building a Smith Chart in JavaScript: Inside the Rendering Pipeline
See how SciChart.js was extended to build a fully interactive Smith chart using standard APIs. This article highlights the flexibility of custom rendering and advanced interactions.

In this blog series we compare JavaScript Charts. There are a wide range of libraries for creating charts and graphs in React, JavaScript, Angular or Vue. Choosing the right one for your needs requires careful thought, and our helpful guides shed some light on the best JavaScript charts and graphs to help you make the right choice for your charting applications.
In this post we’re comparing SciChart vs LightningChart. We’re going to discuss what is LightningChart, what are the pros and cons of this library, how the performance of SciChart compares to LightningChart, and finally alternatives to LightningChart for complex, enterprise big-data visualization applications.
LightningChart is a commercial chart library which supports JavaScript/TypeScript (web browser applications), as well as .NET desktop applications (WPF, WinForms and UWP) and Python for data scientists. The library supports a wide range of chart types and data visualization techniques, including 2D and 3D charts, scientific charts, medical charts, real-time charts, spectrograms, and heatmaps.
It leverages GPU acceleration such as WebGL in the browser and DirectX on the desktop, making it highly optimized for specific workloads. It’s often faster than general-purpose open-source chart libraries in performance-heavy scenarios. But what are the best alternatives on the market for enterprise big-data visualization, medical or scientific apps?
For applications with demanding big-data or performance requirements, SciChart with its GPU-accelerated charts is one of the few libraries in our public Chart Bench benchmark suite that performs competitively with LightningChart in these scenarios. We’ll share some performance test results below and compare the two libraries from a developer perspective.
SciChart is designed for demanding big-data and real-time visualization workloads. Built on top of a proprietary, cross-platform rendering engine using C++ SciChart supports targeting WebGL in browser as well as desktop and mobile based hardware-acceleration APIs, such as OpenGL, DirectX, Metal.
With a fully JavaScript, TypeScript API, React charts library and Angular support, SciChart is designed to integrate into enterprise apps, enabling mission-critical visualization projects without compromising on functionality. SciChart is used in sectors including medical, aerospace, motorsport and finance.
When compared with LightningChart, SciChart differs in the following areas:
Let’s dig into these points in greater detail below:
SciChart is powered by an award-winning cross-platform proprietary rendering engine codenamed Visual Xccelerator™. This advanced engine was built from the ground up in C++ for high performance data-visualization and provides a single shared code-base for SciChart’s Windows, iOS/Android, macOS, Linux and JavaScript charts.
We use this same codebase on Windows, mobile and web by adopting cutting-edge technologies, such as WebAssembly, which allows compilation of C++ codebases into the web and enables a host of optimizations that are not possible with just JavaScript, such as wasm-simd (Single Instruction Multiple Data) and direct memory addressing.
SciChart decided to implement its own technologies to have minimal dependencies on third-party software and to ensure that we can make the innovations that we needed to in data visualization. For example, by adopting a shared C++ codebase, we’re able to target new graphics technologies as they arise: SciChart iOS uses Metal, while Android uses OpenGL, Windows uses DirectX and Web uses WebGL.
Work is currently underway to target DirectX 12, Vulkan and WebGPU using the same graphics engine, allowing us to stay up to date with the latest advancements in graphics technology.
Why build a purpose-built proprietary rendering engine? By abstracting the GPU technology such as DirectX on Windows, OpenGL on Android, Metal on iOS/macOS and WebGL in the browser, SciChart’s rendering engine allows feature-sharing across platforms, and can be optimized as new graphics APIs are released. This allows for better performance, precision and adaptability specific use-cases.
In order to evaluate performance broadly, we’ve created a JavaScript Chart Performance Test app: “Chart Bench”, which examines the performance of a number of libraries in a series of demanding tests. This application benches JavaScript Charts (including SciChart, LightningChart, Plotly.js, eCharts, Chart.js and more) in a variety of use-cases including 2D line series, real-time charts, scatter charts, candlestick and column charts, heatmaps, 3d point-clouds, 3D surface plots, and covers multi chart scenarios. We measured FPS, initialization time, memory and data ingestion rate (points-second).
Benchmark results should always be interpreted in context. Performance varies depending on dataset size, chart types, hardware configuration, and implementation details. In order words, “Results may vary”.
What we found:
In these benchmark runs, SciChart.js v5.0 recorded higher FPS in 84 out of 102 test-cases when compared with LightningChart.js v8.2 on Intel / nVidia hardware, and 81 out of 102 tests on low-powered ARM based hardware.
We encourage readers to run the benchmark on their own target hardware and chart configuration, and to treat performance as one input among others (API fit, docs, support, licensing). Reproducibility can be found in section #2.3.
Here’s the results below in detail.
In these tests, SciChart.js v5 performs as follows vs. LightningChart v8 on an Intel i9 / nVidia 4090 workstation:
| Realtime FIFO / ECG Chart Test | SciChart.js v5 FPS | LightningChart v8.2 FPS | Fastest | % Change |
|---|---|---|---|---|
| 100 points, 5 series | 235.13 | 222.02 | SciChart.js | 5.90% |
| 10000 points, 5 series | 235.69 | 234.71 | SciChart.js | 0.42% |
| 100000 points, 5 series | 236.14 | 235.78 | SciChart.js | 0.15% |
| 1000000 points, 5 series | 79.21 | 81.35 | LCJS v8 | -2.63% |
| 5000000 points, 5 series | 29.09 | 31.53 | LCJS v8 | -7.74% |
| 10000000 points, 5 series | 19.4 | 31.5 | LCJS v8 | -38.41% |
| Realtime Xy Line Series Test | SciChart.js Avg FPS | LightningChart v8.2 FPS | Fastest | % Change |
| 1000 points, 1 series | 236.96 | 224.06 | SciChart.js | 5.76% |
| 10000 points, 1 series | 237.37 | 220.41 | SciChart.js | 7.69% |
| 50000 points, 1 series | 236.85 | 162.51 | SciChart.js | 45.74% |
| 100000 points, 1 series | 236.76 | 87.89 | SciChart.js | 169.38% |
| 200000 points, 1 series | 194.96 | 46.91 | SciChart.js | 315.60% |
| 500000 points, 1 series | 89.43 | 19.33 | SciChart.js | 362.65% |
| 1000000 points, 1 series | 50.31 | 9.99 | SciChart.js | 403.60% |
| 5000000 points, 1 series | 9.39 | 1.8 | SciChart.js | 421.67% |
| 10000000 points, 1 series | 2.86 | 0.66 | SciChart.js | 333.33% |
| Realtime Scatter Chart Test | SciChart.js Avg FPS | LightningChart v8.2 FPS | Fastest | % Change |
| 1000 points, 1 series | 236.99 | 224.58 | SciChart.js | 5.53% |
| 10000 points, 1 series | 239.32 | 234.69 | SciChart.js | 1.97% |
| 50000 points, 1 series | 239.21 | 196.33 | SciChart.js | 21.84% |
| 100000 points, 1 series | 239.37 | 131.13 | SciChart.js | 82.54% |
| 200000 points, 1 series | 237.52 | 97.84 | SciChart.js | 142.76% |
| 500000 points, 1 series | 98.71 | 67.14 | SciChart.js | 47.02% |
| 1000000 points, 1 series | 59.33 | 38.4 | SciChart.js | 54.51% |
| 5000000 points, 1 series | 10.54 | 7.32 | SciChart.js | 43.99% |
| 10000000 points, 1 series | 5.39 | 3.81 | SciChart.js | 41.47% |
| Static Mountain Chart Test | SciChart.js Avg FPS | LightningChart v8.2 FPS | Fastest | % Change |
| 1000 points, 1 series | 238.31 | 219.77 | SciChart.js | 8.44% |
| 10000 points, 1 series | 239.28 | 226.17 | SciChart.js | 5.80% |
| 50000 points, 1 series | 238.79 | 236.25 | SciChart.js | 1.08% |
| 100000 points, 1 series | 237.53 | 232.25 | SciChart.js | 2.27% |
| 200000 points, 1 series | 236.18 | 232.68 | SciChart.js | 1.50% |
| 500000 points, 1 series | 239.53 | 234.72 | SciChart.js | 2.05% |
| 1000000 points, 1 series | 239.39 | 233.35 | SciChart.js | 2.59% |
| 5000000 points, 1 series | 237.01 | 228.01 | SciChart.js | 3.95% |
| 10000000 points, 1 series | 236 | 220.89 | SciChart.js | 6.84% |
| Static Column Chart Test | SciChart.js Avg FPS | LightningChart v8.2 FPS | Fastest | % Change |
| 1000 points, 1 series | 235.55 | 224.11 | SciChart.js | 5.10% |
| 10000 points, 1 series | 238.56 | 234.57 | SciChart.js | 1.70% |
| 50000 points, 1 series | 239.09 | 206.34 | SciChart.js | 15.87% |
| 100000 points, 1 series | 239.14 | 131.22 | SciChart.js | 82.24% |
| 200000 points, 1 series | 239.36 | 215.9 | SciChart.js | 10.87% |
| 500000 points, 1 series | 239.44 | HANGING | SciChart.js | N/A |
| 1000000 points, 1 series | 238.79 | SKIPPED | SciChart.js | N/A |
| 5000000 points, 1 series | 238.23 | SKIPPED | SciChart.js | N/A |
| 10000000 points, 1 series | 237.03 | SKIPPED | SciChart.js | N/A |
| Static Candlestick Chart Test | SciChart.js Avg FPS | LightningChart v8.2 FPS | Fastest | % Change |
| 1000 points, 1 series | 236.08 | 224.3 | SciChart.js | 5.25% |
| 10000 points, 1 series | 236.18 | 217.39 | SciChart.js | 8.64% |
| 50000 points, 1 series | 234.73 | 193.82 | SciChart.js | 21.11% |
| 100000 points, 1 series | 234.84 | 146.85 | SciChart.js | 59.92% |
| 200000 points, 1 series | 233.6 | 141.16 | SciChart.js | 65.49% |
| 500000 points, 1 series | 234.46 | 37.64 | SciChart.js | 522.90% |
| 1000000 points, 1 series | 234.66 | 10.94 | SciChart.js | 2044.97% |
| 5000000 points, 1 series | 232.69 | HANGING | SciChart.js | N/A |
| 10000000 points, 1 series | 228.04 | SKIPPED | SciChart.js | N/A |
| Realtime Uniform Heatmap Test | SciChart.js Avg FPS | LightningChart v8.2 FPS | Fastest | % Change |
| 100×100 Heatmap | 235.67 | 228.79 | SciChart.js | 3.01% |
| 200×200 Heatmap | 235.76 | 231.02 | SciChart.js | 2.05% |
| 500×500 Heatmap | 143.55 | 93.16 | SciChart.js | 54.09% |
| 1000×1000 Heatmap | 39.97 | 27.75 | SciChart.js | 44.04% |
| 2000×2000 Heatmap | 9.48 | 6.87 | SciChart.js | 37.99% |
| 4000×4000 Heatmap | 2.32 | 2.94 | LCJS v8 | -21.09% |
| 8000×8000 Heatmap | 0.48 | 0.64 | LCJS v8 | -25.00% |
| 16000×16000 Heatmap | SKIPPED | SKIPPED | – | N/A |
| Realtime Multi Chart Performance Test | SciChart.js Avg FPS | LightningChart v8.2 FPS | Fastest | % Change |
| 100000 points, 1 series, 1 charts | 155.75 | 220.39 | LCJS v8 | -29.33% |
| 100000 points, 1 series, 2 charts | 124.67 | 166.78 | LCJS v8 | -25.25% |
| 100000 points, 1 series, 4 charts | 103.76 | 71.55 | SciChart.js | 45.02% |
| 100000 points, 1 series, 8 charts | 71.09 | 31.45 | SciChart.js | 126.04% |
| 100000 points, 1 series, 16 charts | 42.75 | 10.6 | SciChart.js | 303.30% |
| 100000 points, 1 series, 32 charts | 26.78 | HANGING | SciChart.js | N/A |
| 100000 points, 1 series, 64 charts | 12.46 | SKIPPED | SciChart.js | N/A |
| 100000 points, 1 series, 128 charts | 7.9 | SKIPPED | SciChart.js | N/A |
| Realtime 3D Point Cloud Performance Test | SciChart.js Avg FPS | LightningChart v8.2 FPS | Fastest | % Change |
| 100 points, 1 series | 228.32 | 225.67 | SciChart.js | 1.17% |
| 1000 points, 1 series | 230.18 | 236.47 | LCJS v8 | -2.66% |
| 10000 points, 1 series | 229.52 | 236.65 | LCJS v8 | -3.01% |
| 100000 points, 1 series | 121.34 | 81.76 | SciChart.js | 48.41% |
| 1000000 points, 1 series | 15.09 | 7.28 | SciChart.js | 107.28% |
| 2000000 points, 1 series | 7.52 | 3.84 | SciChart.js | 95.83% |
| 4000000 points, 1 series | 3.51 | 1.76 | SciChart.js | 99.43% |
| Realtime 3D Surface Performance Test | SciChart.js Avg FPS | LightningChart v8.2 FPS | Fastest | % Change |
| 100 points, 1 series | 229.21 | 224.76 | SciChart.js | 1.98% |
| 200 points, 1 series | 231.35 | 193.44 | SciChart.js | 19.60% |
| 500 points, 1 series | 95.62 | 66.45 | SciChart.js | 43.90% |
| 1000 points, 1 series | 27.69 | 19.06 | SciChart.js | 45.28% |
| 2000 points, 1 series | 5.96 | 4.49 | SciChart.js | 32.74% |
| 4000 points, 1 series | 1.28 | 1.76 | LCJS v8 | -27.27% |
| 8000 points, 1 series | HANGING | HANGING | – | N/A |
| Realtime Line Series Append Test | SciChart.js Avg FPS | LightningChart v8.2 FPS | Fastest | % Change |
| 1000 points, 1 series | 238.16 | 228.12 | SciChart.js | 4.40% |
| 10000 points, 1 series | 239.14 | 237.86 | SciChart.js | 0.54% |
| 100000 points, 1 series | 173.61 | 226.5 | LCJS v8 | -23.35% |
| 1000000 points, 1 series | 69.38 | 155.83 | LCJS v8 | -55.48% |
| 10000000 points, 1 series | 21.84 | 20.91 | SciChart.js | 4.45% |
| Realtime Point Series Updating in Y-Value | SciChart.js Avg FPS | LightningChart v8.2 FPS | Fastest | % Change |
| 1000 points, 1 series | 232.98 | 227.58 | SciChart.js | 2.37% |
| 10000 points, 1 series | 235.00 | 213.43 | SciChart.js | 10.11% |
| 50000 points, 1 series | 235.87 | 231.88 | SciChart.js | 1.72% |
| 100000 points, 1 series | 234.77 | 150.75 | SciChart.js | 55.73% |
| 200000 points, 1 series | 205.01 | 79.47 | SciChart.js | 157.97% |
| 500000 points, 1 series | 94.45 | 27.99 | SciChart.js | 237.44% |
| 1000000 points, 1 series | 62.94 | 13.11 | SciChart.js | 380.09% |
| 5000000 points, 1 series | 11.69 | 2.25 | SciChart.js | 419.56% |
| 10000000 points, 1 series | 4.82 | 0.91 | SciChart.js | 429.67% |
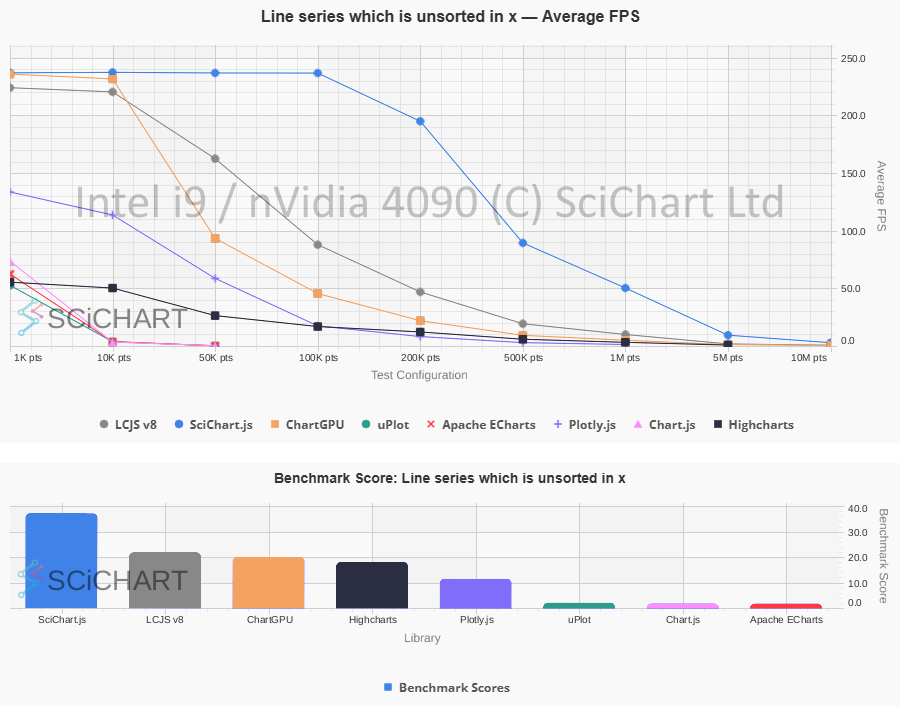
| Static N line series x M points Test | SciChart.js Avg FPS | LightningChart v8.2 FPS | Fastest | % Change |
| 100 points, 100 series | 235.3 | 224.7 | SciChart.js | 4.72% |
| 200 points, 200 series | 235.92 | 231.64 | SciChart.js | 1.85% |
| 500 points, 500 series | 129.03 | 134.99 | LCJS v8 | -4.42% |
| 1000 points, 1000 series | 63.71 | 78.7 | LCJS v8 | -19.05% |
| 2000 points, 2000 series | 27.43 | 39.65 | LCJS v8 | -30.82% |
| 4000 points, 4000 series | 9.67 | 15.49 | LCJS v8 | -37.57% |
| 8000 points, 8000 series | 2.19 | HANGING | SciChart.js | N/A |
| AVERAGES / TOTALS | 152.90 FPS | 128.86 FPS | SciChart.js: 84 Wins LCJS v8: 16 Wins | 87.34% |
Table 1: SciChart.js v5.0 vs LightningChart.js v8.2 on Intel i9 / nVidia 4090 RTX. A test marked as ‘Hanging’ means the chart library did not complete the test in the allotted time. ‘Skipped’ means further tests were skipped either due to borderline times in previous test, or if a previous test was marked as errored. % Change column signifies the percentage faster (positive number) for SciChart.js vs. LightningChart, or slower (negative number).
These table test results were outputted by Chart Bench and recorded on an Intel i9 / nVidia 4090 workstation, measuring FPS stats, as well as Data Ingestion Rate (points per second), Memory usage and Initialization time under specific workloads and test conditions as published in our test suite. In this test setup and on this specific hardware, the summary of the test results are as follows:
Intel i9 / nVidia 4090 Workstation Test Results
- SciChart.js v5.0: Scores ‘Fastest’ (Highest average FPS recorded in the test) in 84 out of 102 test cases.
- LightningChart.js v8.2.0: Scores ‘Fastest’ (Highest average FPS recorded in the test) in 16 out of 102 test cases.
- SciChart.js v5.0 recorded an average FPS across all tests of 152.90 FPS vs. LightningChart recording 128.86 FPS.
- SciChart.js was on average +87.34% faster than LightningChart across all test cases, with a maximum of +2044.97% faster (Candlestick series 1M points) and minimum of -55.48% (Realtime Line Series Append, 1M points)
- Two tests were marked as N/A as neither chart library completed the test case.
Below are a selection of graphs outputted by Chart Bench which can be viewed at the end of a test run. These graphs include all the chart libraries tested: SciChart.js, HighCharts, Chart.js, Plotly.js, Apache eCharts, uPlot, ChartGPU, LightningChart.js (LCJS) versions 4.2.2 and 8.2.0. FPS results means “frames per second” (higher is better). An aggregated Chart Bench score is also computed (explained in this blog) which takes into account FPS, Memory usage, Init time and total number of frames rendered.
 SciChart.js vs. LightningChart: Real-time Xy Line Series Performance on Intel i9 / nVidia 4090
 SciChart.js vs. LightningChart: Real-time Line Series Appending Performance on Intel i9 / nVidia 4090
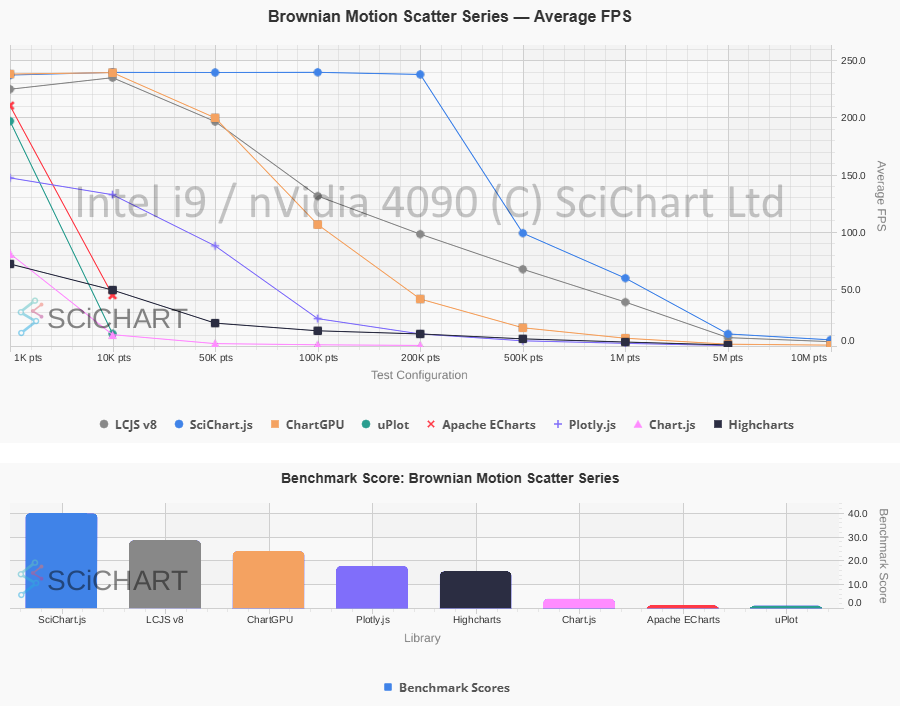 SciChart.js vs. LightningChart: Real-time Scatter Chart Performance on Intel i9 / nVidia 4090
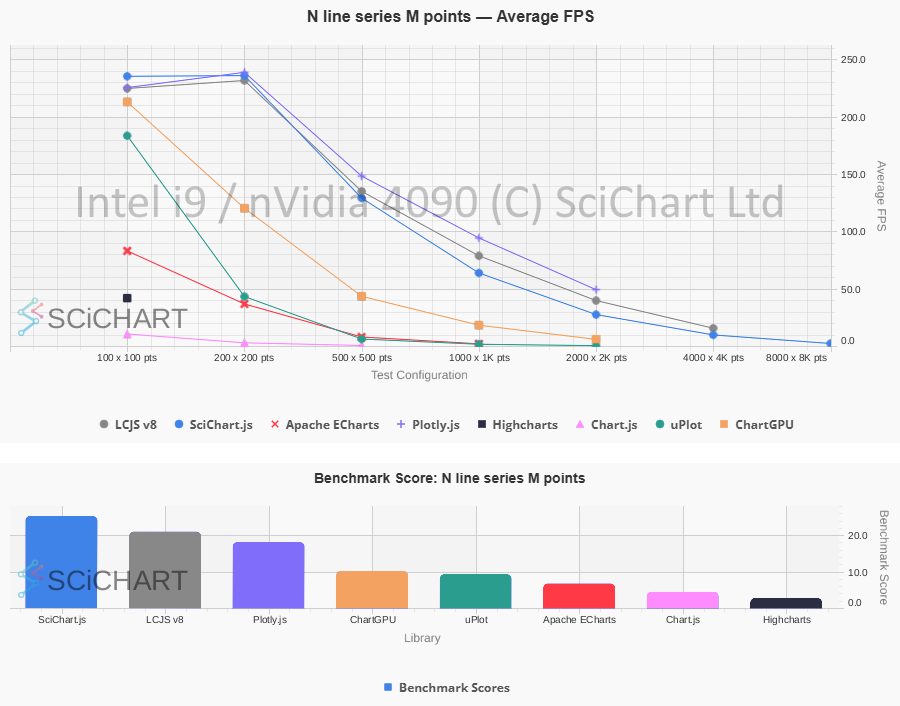 SciChart.js vs. LightningChart: N Lines x M Points Line Chart Performance on Intel i9 / nVidia 4090
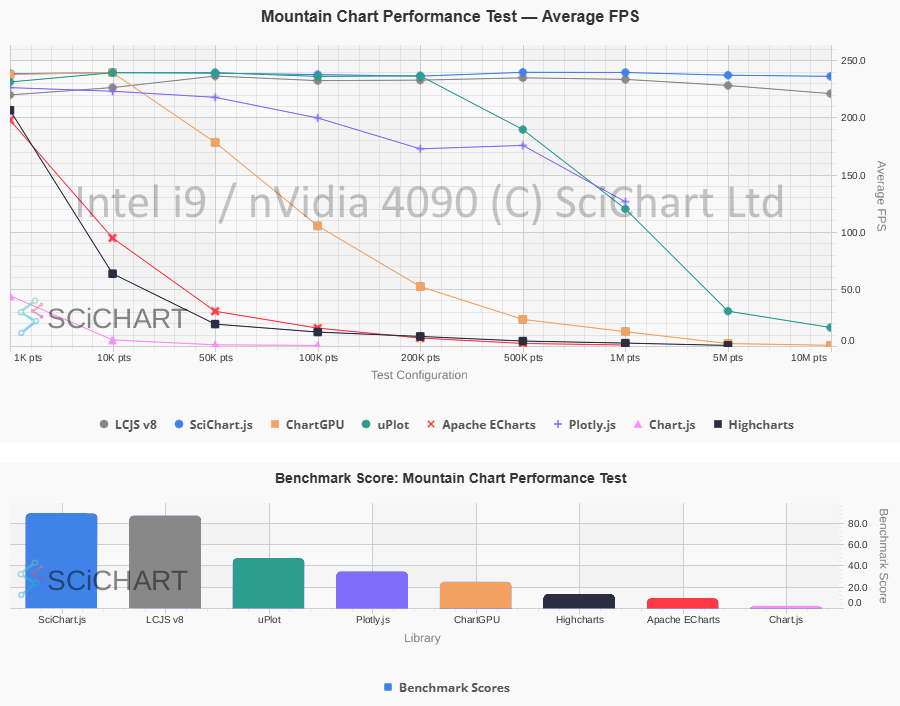 SciChart.js vs. LightningChart: Mountain Chart Performance on Intel i9 / nVidia 4090
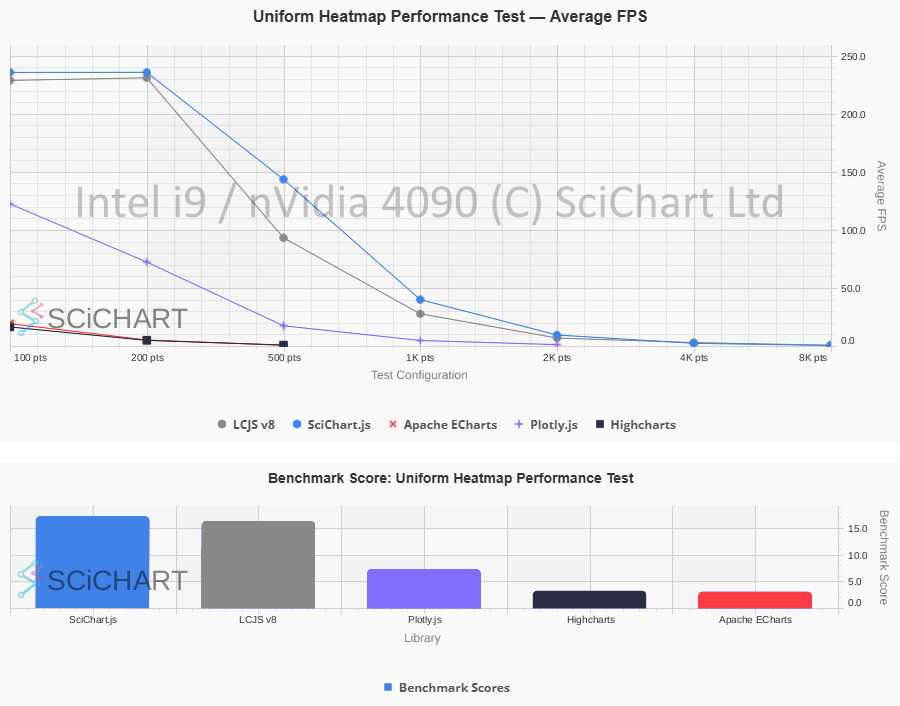 SciChart.js vs. LightningChart: Heatmap Chart Performance on Intel i9 / nVidia 4090
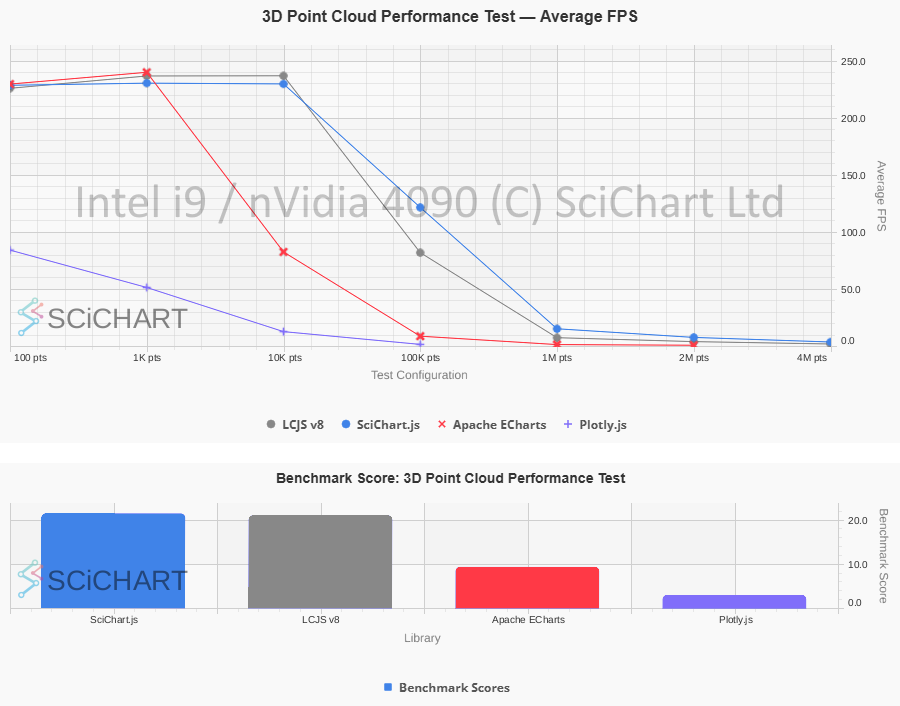 SciChart.js vs. LightningChart: 3D Point Cloud Chart Performance on Intel i9 / nVidia 4090
 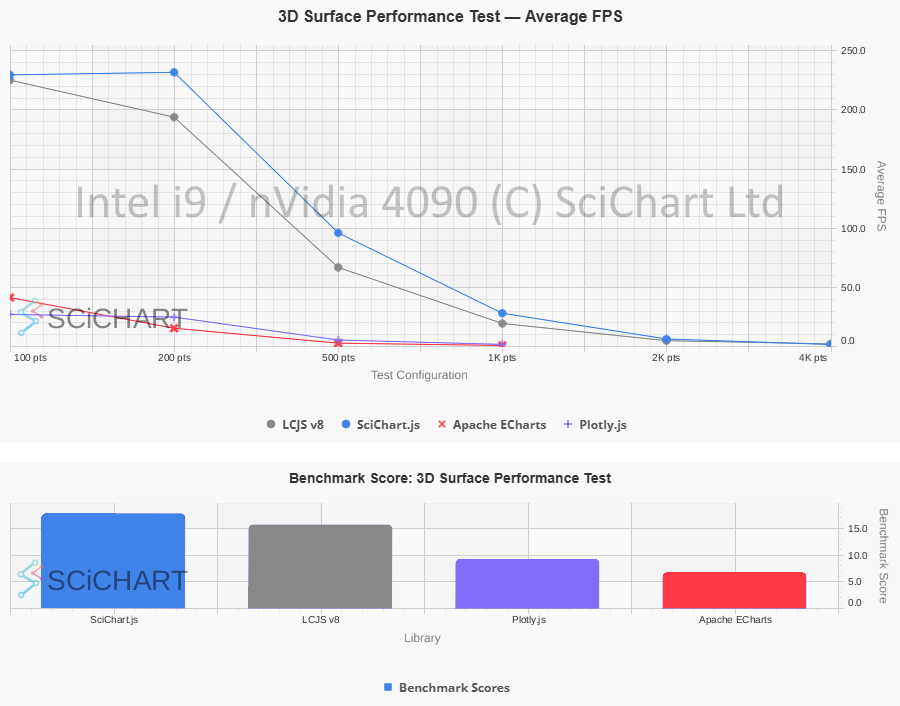 SciChart.js vs. LightningChart: 3D Surface Chart Performance on Intel i9 / nVidia 4090
 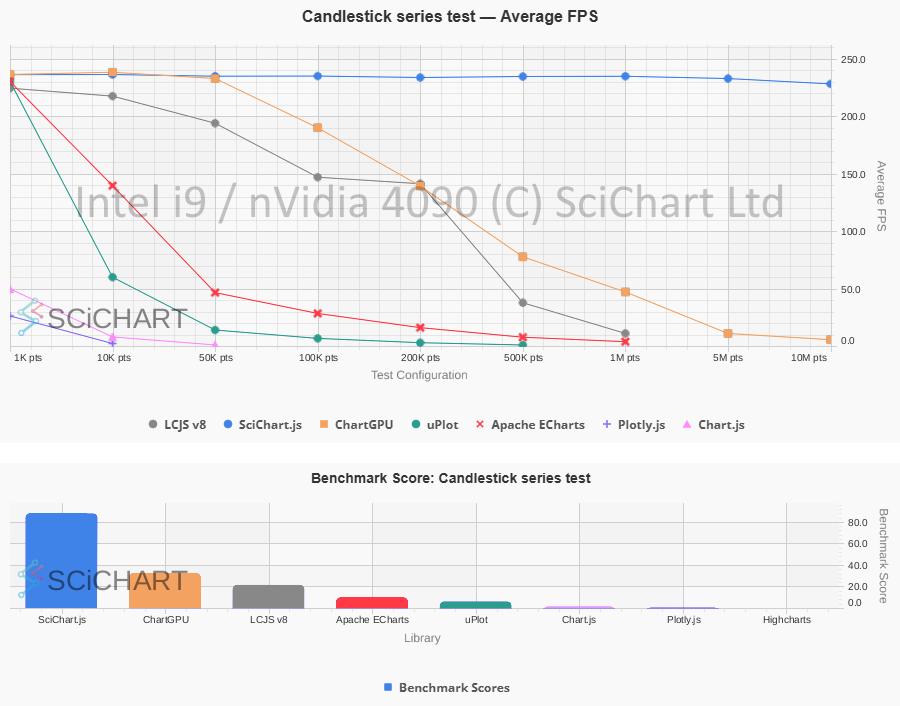 SciChart.js vs. LightningChart: Candlestick Chart Performance on Intel i9 / nVidia 4090
 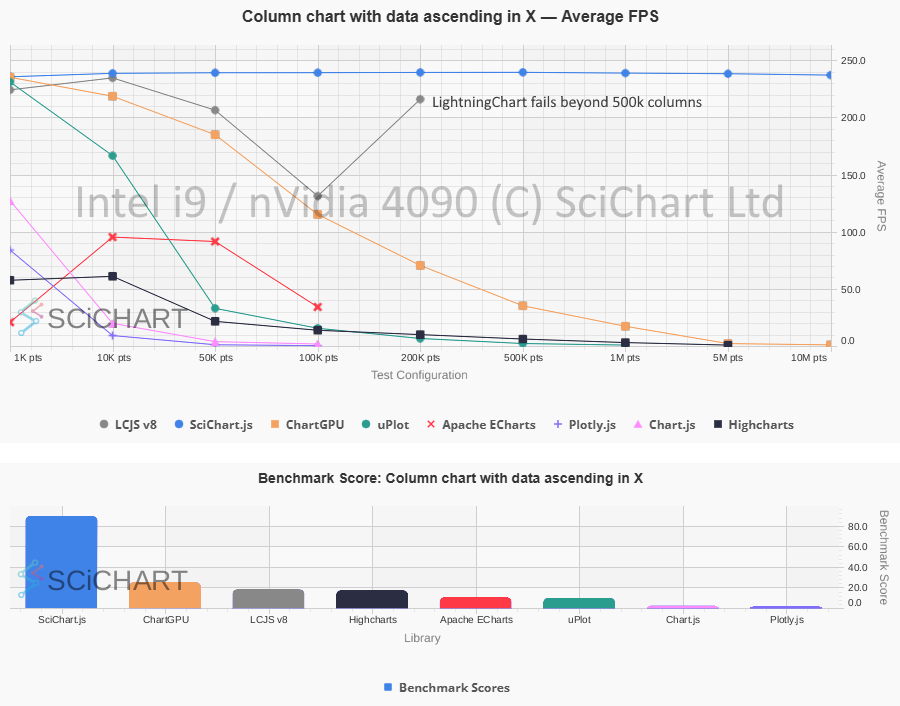 SciChart.js vs. LightningChart: Column Chart Performance on Intel i9 / nVidia 4090
 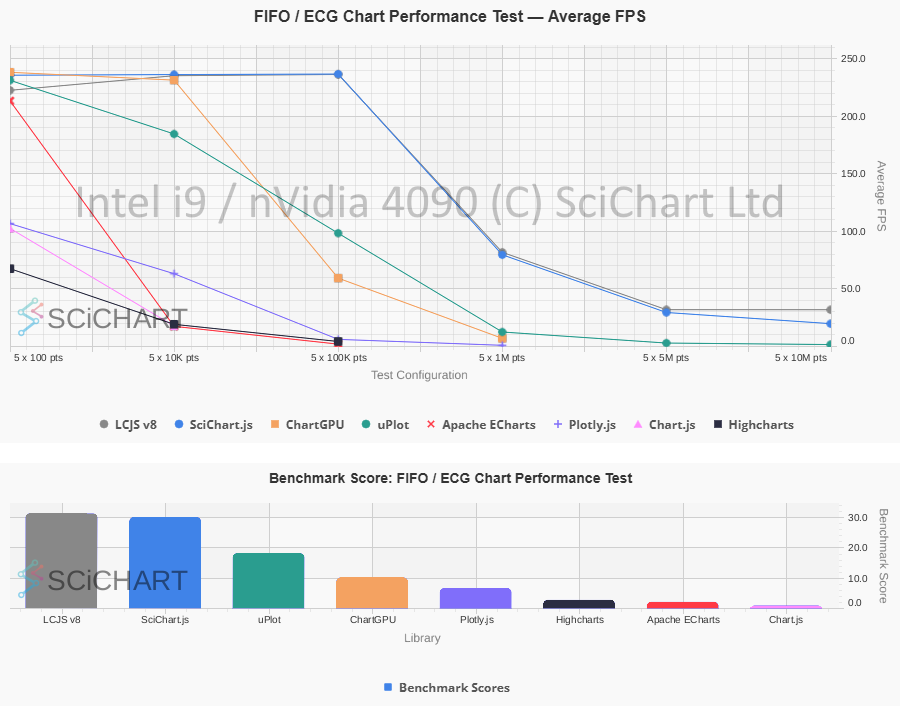 SciChart.js vs. LightningChart: Real-time FIFO/ECG Line Chart Performance on Intel i9 / nVidia 4090
It should be noted that both libraries are extremely fast. In some scenarios, both libraries performed substantially faster than general-purpose alternatives (Plotly.js, Apache eCharts etc…). The ultimate choice should come down to other value-adds such as the ease of use of the API, documentation/example code materials, useability, pricing and the rating of technical support.
Not everyone has a high powered workstation with the latest nVidia graphics card to run data visualization apps. In fact, SciChart is often used in embedded hardware (low-powered ARM single-board computers), mobile devices, and PCs with integrated graphics. You cannot always control which hardware spec your users of SaaS apps have. That’s why we’ve taken the extra effort to optimize SciChart on lower-end hardware, using load-balancing (a mix of CPU with SIMD for data processing / GPU rendering) to balance performance.
Using Chart Bench, we also ran the performance tests on a Lenovo ARM Mini-PC with Snapdragon X126100 processor, Qualcomm Adreno X1-45 GPU and 32GB of RAM. In this GPU-constrained environment, with limited shared VRAM, how do the two libraries perform?
| Realtime FIFO / ECG Chart Test | SciChart.js FPS | LightningChart FPS | Fastest | % Change |
|---|---|---|---|---|
| 100 points, 5 series | 58.92 | 54.59 | SciChart.js | 7.93% |
| 10000 points, 5 series | 59.2 | 59.13 | SciChart.js | 0.12% |
| 100000 points, 5 series | 59.22 | 59.09 | SciChart.js | 0.22% |
| 1000000 points, 5 series | 59.27 | 58.43 | SciChart.js | 1.44% |
| 5000000 points, 5 series | 32.36 | 30.57 | SciChart.js | 5.86% |
| 10000000 points, 5 series | 25.69 | 28.48 | LCJS v8 | -9.80% |
| Realtime Xy Line Series Test | SciChart.js FPS | LightningChart FPS | Fastest | % Change |
| 1000 points, 1 series | 58.98 | 54.27 | SciChart.js | 8.68% |
| 10000 points, 1 series | 59.46 | 59.39 | SciChart.js | 0.12% |
| 50000 points, 1 series | 59.45 | 19.5 | SciChart.js | 204.87% |
| 100000 points, 1 series | 59.48 | 10.3 | SciChart.js | 477.48% |
| 200000 points, 1 series | 56.2 | 5.38 | SciChart.js | 944.61% |
| 500000 points, 1 series | 24.53 | 2.45 | SciChart.js | 901.22% |
| 1000000 points, 1 series | 13.65 | HANGING | SciChart.js | N/A |
| 5000000 points, 1 series | 2.36 | SKIPPED | SciChart.js | N/A |
| 10000000 points, 1 series | 1.03 | SKIPPED | SciChart.js | N/A |
| Realtime Scatter Chart Test | SciChart.js FPS | LightningChart FPS | Fastest | % Change |
| 1000 points, 1 series | 59.31 | 54.54 | SciChart.js | 8.75% |
| 10000 points, 1 series | 59.11 | 59.3 | LCJS v8 | -0.32% |
| 50000 points, 1 series | 59.1 | 59.38 | LCJS v8 | -0.47% |
| 100000 points, 1 series | 59.15 | 59.14 | SciChart.js | 0.02% |
| 200000 points, 1 series | 59.19 | 35.01 | SciChart.js | 69.07% |
| 500000 points, 1 series | 59.46 | 12.88 | SciChart.js | 361.65% |
| 1000000 points, 1 series | 39.67 | 4.28 | SciChart.js | 826.87% |
| 5000000 points, 1 series | 7.15 | 0.28 | SciChart.js | 2453.57% |
| 10000000 points, 1 series | 3.57 | SKIPPED | SciChart.js | N/A |
| Static Mountain Chart Test | SciChart.js FPS | LightningChart FPS | Fastest | % Change |
| 1000 points, 1 series | 56.23 | 53.45 | SciChart.js | 5.20% |
| 10000 points, 1 series | 59.13 | 59.4 | LCJS v8 | -0.45% |
| 50000 points, 1 series | 59.13 | 59.34 | LCJS v8 | -0.35% |
| 100000 points, 1 series | 59.12 | 59.11 | SciChart.js | 0.02% |
| 200000 points, 1 series | 59.19 | 59.24 | LCJS v8 | -0.08% |
| 500000 points, 1 series | 59.27 | 59.06 | SciChart.js | 0.36% |
| 1000000 points, 1 series | 59.56 | 59.13 | SciChart.js | 0.73% |
| 5000000 points, 1 series | 59.69 | 57.74 | SciChart.js | 3.38% |
| 10000000 points, 1 series | 59.11 | 56.18 | SciChart.js | 5.22% |
| Static Column Chart Test | SciChart.js FPS | LightningChart FPS | Fastest | % Change |
| 1000 points, 1 series | 55.55 | 54.61 | SciChart.js | 1.72% |
| 10000 points, 1 series | 59.13 | 58.34 | SciChart.js | 1.35% |
| 50000 points, 1 series | 59.09 | 57.35 | SciChart.js | 3.03% |
| 100000 points, 1 series | 59.11 | 55.16 | SciChart.js | 7.16% |
| 200000 points, 1 series | 59.16 | 54.12 | SciChart.js | 9.31% |
| 500000 points, 1 series | 59.28 | HANGING | SciChart.js | N/A |
| 1000000 points, 1 series | 59.59 | SKIPPED | SciChart.js | N/A |
| 5000000 points, 1 series | 59.33 | SKIPPED | SciChart.js | N/A |
| 10000000 points, 1 series | 59.68 | SKIPPED | SciChart.js | N/A |
| Static Candlestick Chart Test | SciChart.js Avg FPS | LightningChart FPS | Fastest | % Change |
| 1000 points, 1 series | 58.16 | 53.24 | SciChart.js | 9.24% |
| 10000 points, 1 series | 58.96 | 59.03 | LCJS v8 | -0.12% |
| 50000 points, 1 series | 59.46 | 58.76 | SciChart.js | 1.19% |
| 100000 points, 1 series | 59.2 | 50.45 | SciChart.js | 17.34% |
| 200000 points, 1 series | 59.36 | 5.88 | SciChart.js | 909.52% |
| 500000 points, 1 series | 58.95 | 2.32 | SciChart.js | 2440.95% |
| 1000000 points, 1 series | 59.31 | HANGING | SciChart.js | N/A |
| 5000000 points, 1 series | 58.24 | SKIPPED | SciChart.js | N/A |
| 10000000 points, 1 series | 57.38 | SKIPPED | SciChart.js | N/A |
| Realtime Uniform Heatmap Test | SciChart.js Avg FPS | LightningChart FPS | Fastest | % Change |
| 100 points, 1 series | 58.79 | 54.41 | SciChart.js | 8.05% |
| 200 points, 1 series | 59.22 | 59.37 | LCJS v8 | -0.25% |
| 500 points, 1 series | 59.29 | 59.5 | LCJS v8 | -0.35% |
| 1000 points, 1 series | 46.34 | 29.25 | SciChart.js | 58.43% |
| 2000 points, 1 series | 10.64 | 6.91 | SciChart.js | 53.98% |
| 4000 points, 1 series | 2.46 | 2.96 | LCJS v8 | -16.89% |
| 8000 points, 1 series | HANGING | 0.64 | LCJS v8 | N/A |
| 16000 points, 1 series | SKIPPED | SKIPPED | N/A | N/A |
| Realtime Multi Chart Performance Test | SciChart.js FPS | LightningChart FPS | Fastest | % Change |
| 100000 points, 1 series, 1 charts | 58.58 | 54.56 | SciChart.js | 7.37% |
| 100000 points, 1 series, 2 charts | 59.27 | 58.46 | SciChart.js | 1.39% |
| 100000 points, 1 series, 4 charts | 59.39 | 37.18 | SciChart.js | 59.74% |
| 100000 points, 1 series, 8 charts | 58.57 | 16.75 | SciChart.js | 249.67% |
| 100000 points, 1 series, 16 charts | 49.21 | 6.32 | SciChart.js | 678.64% |
| 100000 points, 1 series, 32 charts | 29.72 | HANGING | SciChart.js | N/A |
| 100000 points, 1 series, 64 charts | 17.24 | SKIPPED | SciChart.js | N/A |
| 100000 points, 1 series, 128 charts | 7.39 | SKIPPED | SciChart.js | N/A |
| Realtime 3D Point Cloud Performance Test | SciChart.js FPS | LightningChart FPS | Fastest | % Change |
| 100 points, 1 series | 55.68 | 54.44 | SciChart.js | 2.28% |
| 1000 points, 1 series | 56.77 | 59.16 | LCJS v8 | -4.04% |
| 10000 points, 1 series | 57.95 | 59.39 | LCJS v8 | -2.42% |
| 100000 points, 1 series | 57.66 | 9.38 | SciChart.js | 514.71% |
| 1000000 points, 1 series | 12.38 | 6.48 | SciChart.js | 91.05% |
| 2000000 points, 1 series | 6.09 | 3.66 | SciChart.js | 66.39% |
| 4000000 points, 1 series | 2.81 | 1.84 | SciChart.js | 52.72% |
| Realtime 3D Surface Performance Test | SciChart.js FPS | LightningChart FPS | Fastest | % Change |
| 100 points, 1 series | 55.93 | 54.23 | SciChart.js | 3.13% |
| 200 points, 1 series | 57.81 | 58.51 | LCJS v8 | -1.20% |
| 500 points, 1 series | 57.51 | 56.52 | SciChart.js | 1.75% |
| 1000 points, 1 series | 20.96 | 18.38 | SciChart.js | 14.04% |
| 2000 points, 1 series | 5.04 | 4.15 | SciChart.js | 21.45% |
| 4000 points, 1 series | 1.13 | 0.59 | SciChart.js | 91.53% |
| 8000 points, 1 series | HANGING | SKIPPED | N/A | N/A |
| Realtime Line Series Append Test | SciChart.js FPS | LightningChart FPS | Fastest | % Change |
| 1000 points, 1 series | 59.32 | 54.49 | SciChart.js | 8.86% |
| 10000 points, 1 series | 59.1 | 59.38 | LCJS v8 | -0.47% |
| 100000 points, 1 series | 58.74 | 59.35 | LCJS v8 | -1.03% |
| 1000000 points, 1 series | 52.14 | 56.94 | LCJS v8 | -8.43% |
| 10000000 points, 1 series | 23.82 | 19.91 | SciChart.js | 19.64% |
| Realtime Point Series Updating in Y-Value | SciChart.js FPS | LightningChart FPS | Fastest | % Change |
| 1000 points, 1 series | 58.85 | 54.08 | SciChart.js | 8.82% |
| 10000 points, 1 series | 59.08 | 59.39 | LCJS v8 | -0.52% |
| 50000 points, 1 series | 59.10 | 23.18 | SciChart.js | 154.96% |
| 100000 points, 1 series | 59.10 | 12.23 | SciChart.js | 383.24% |
| 200000 points, 1 series | 59.14 | 6.45 | SciChart.js | 816.90% |
| 500000 points, 1 series | 58.89 | 2.44 | SciChart.js | 2313.52% |
| 1000000 points, 1 series | 54.82 | 0.86 | SciChart.js | 6274.42% |
| 5000000 points, 1 series | 8.84 | SKIPPED | SciChart.js | N/A |
| 10000000 points, 1 series | 3.30 | SKIPPED | SciChart.js | N/A |
| Static N line series x M points Test | SciChart.js FPS | LightningChart FPS | Fastest | % Change |
| 100 points, 100 series | 58.76 | 54.29 | SciChart.js | 8.23% |
| 200 points, 200 series | 58.65 | 58.48 | SciChart.js | 0.29% |
| 500 points, 500 series | 57.66 | 36.89 | SciChart.js | 56.30% |
| 1000 points, 1000 series | 41.57 | 11.8 | SciChart.js | 252.29% |
| 2000 points, 2000 series | 17.11 | 2.07 | SciChart.js | 726.57% |
| 4000 points, 4000 series | 3.93 | HANGING | SciChart.js | N/A |
| 8000 points, 8000 series | HANGING | SKIPPED | N/A | N/A |
| AVERAGES / TOTALS | 46.54 FPS | 37.84 FPS | SciChart.js: 81 Wins LCJS v8: 18 Wins | +279.52% |
Table 2: SciChart.js v5.0 vs LightningChart.js v8.2.0 on ARM Snapdragon Mini-PC with Qualcomm Graphics. A test marked as ‘Hanging’ means the chart library did not complete the test in the allotted time. ‘Skipped’ means further tests were skipped either due to borderline times in previous test, or if a previous test was marked as errored. % Change column signifies the percentage faster (positive number) for SciChart.js vs. LightningChart, or slower (negative number).
These table test results were outputted by Chart Bench and recorded on an ARM Snapdragon / Qualcomm Mini-PC with 32GB RAM, measuring FPS stats, as well as Data Ingestion Rate (points per second), Memory usage & Initialisation time under specific workloads and test conditions as published in our test suite. In this test-setup and on this specific hardware, the summary of the test-results are as follows:
ARM Snapdragon / Qualcomm Mini-PC results Test Results
Summary: The performance gap was even wider for SciChart.js vs. LightningChart on low/mid-level hardware (ARM Snapdragon) vs high-end hardware (Intel i9 / nVidia 4090), with considerably better relative FPS scores for SciChart on the integrated Qualcomm Graphics chip. Further summary of results can be found below:
- SciChart.js v5.0: Scores ‘Fastest’ (Highest average FPS recorded in the test) in 81 out of 102 test cases.
- LightningChart.js v8.2.0: Scores ‘Fastest’ (Highest average FPS recorded in the test) in 18 out of 102 test cases.
- SciChart.js v5.0 recorded an average FPS across all tests of 46.54 FPS vs. LightningChart recording 37.84 FPS.
- SciChart.js was on average +279.52% faster than LightningChart across all test cases, with a maximum of +6274.42% faster (Point Series Updating in Y, 1M points) and mininum of -16.89% (Realtime Line Series Append, 1M points)
- Three tests were marked as N/A as neither chart library completed the test case.
Below are a selection of graphs outputted by Chart Bench which can be viewed at the end of a test run. These graphs include all the chart libraries tested: SciChart.js, HighCharts, Chart.js, Plotly.js, Apache eCharts, uPlot, ChartGPU, LightningChart.js (LCJS) versions 4.2.2 and 8.2.0. FPS results means “frames per second” (higher is better). An aggregated “Chart Bench score” is also computed (explained in this blog) which takes into account FPS, Memory usage, Init time and total number of frames rendered.
 SciChart.js vs. LightningChart: Real-time Xy Line Series Performance on ARM Snapdragon
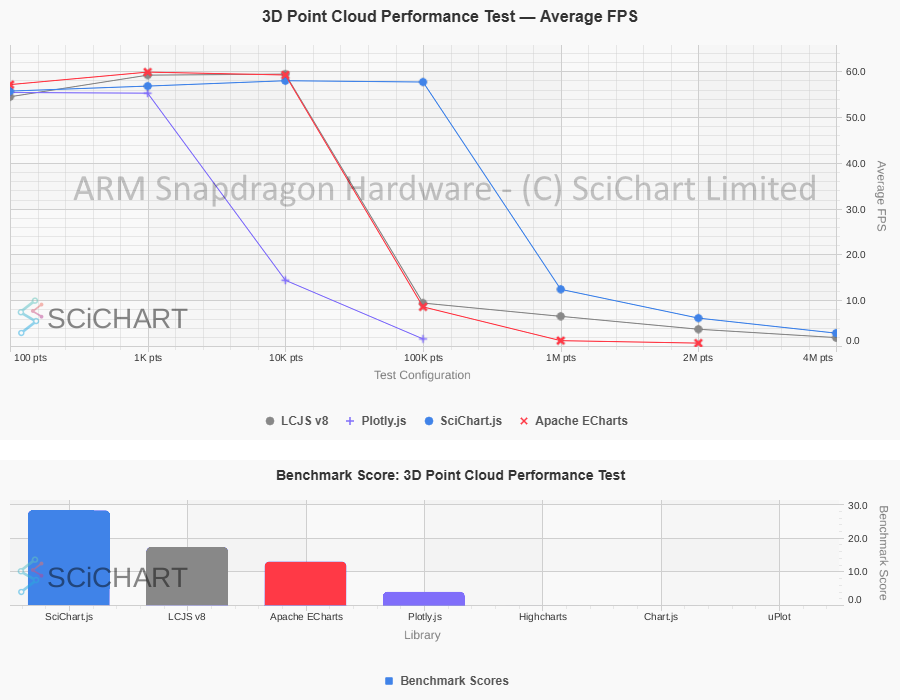 SciChart.js vs. LightningChart: 3D Point Cloud Chart Performance on ARM Snapdragon
 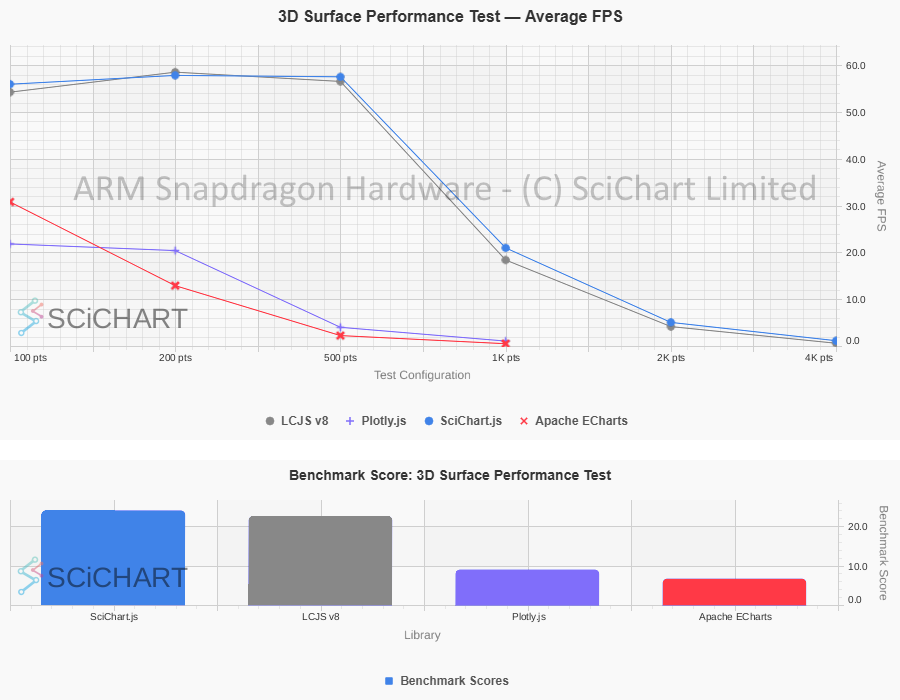 SciChart.js vs. LightningChart: 3D Surface Chart Performance on ARM Snapdragon
 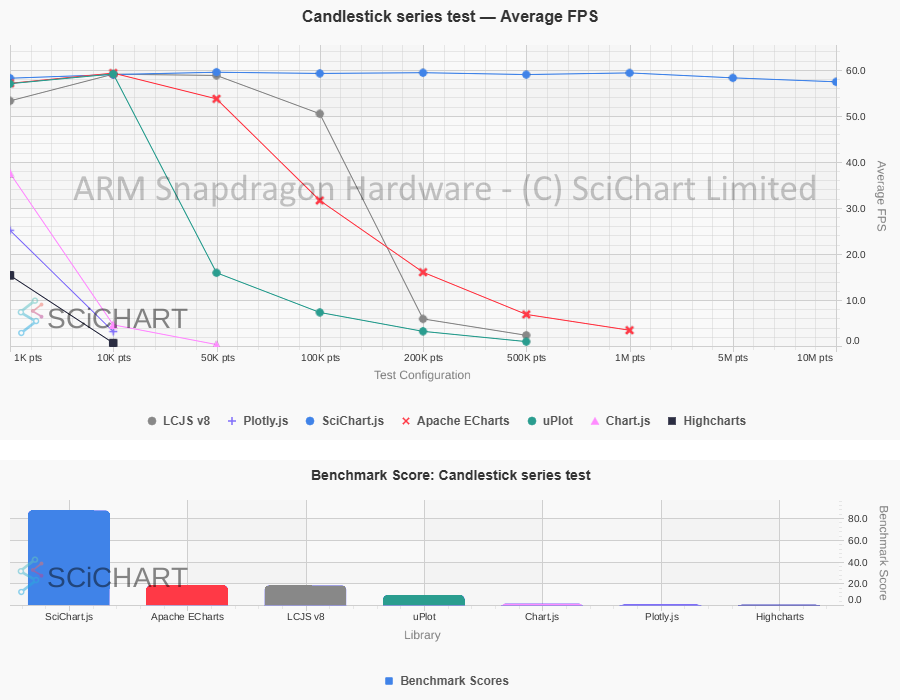 SciChart.js vs. LightningChart: Candlestick Chart Performance on ARM Snapdragon
 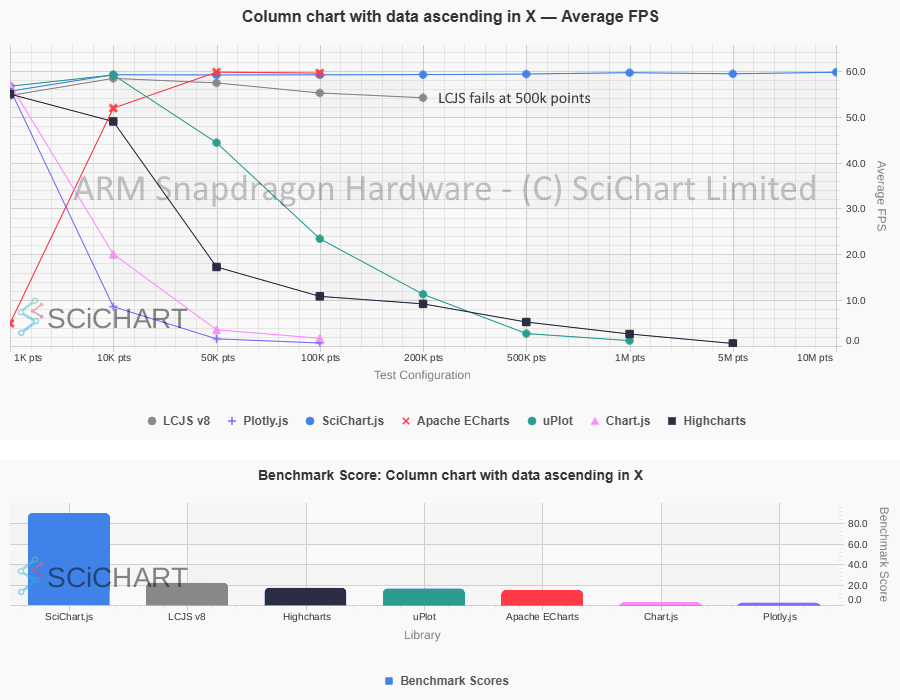 SciChart.js vs. LightningChart: Column Chart Performance on ARM Snapdragon
  SciChart.js vs. LightningChart: Real-time FIFO/ECG Line Chart Performance on ARM Snapdragon
  SciChart.js vs. LightningChart: Heatmap Chart Performance on ARM Snapdragon
  SciChart.js vs. LightningChart: Mountain Chart Performance on ARM Snapdragon
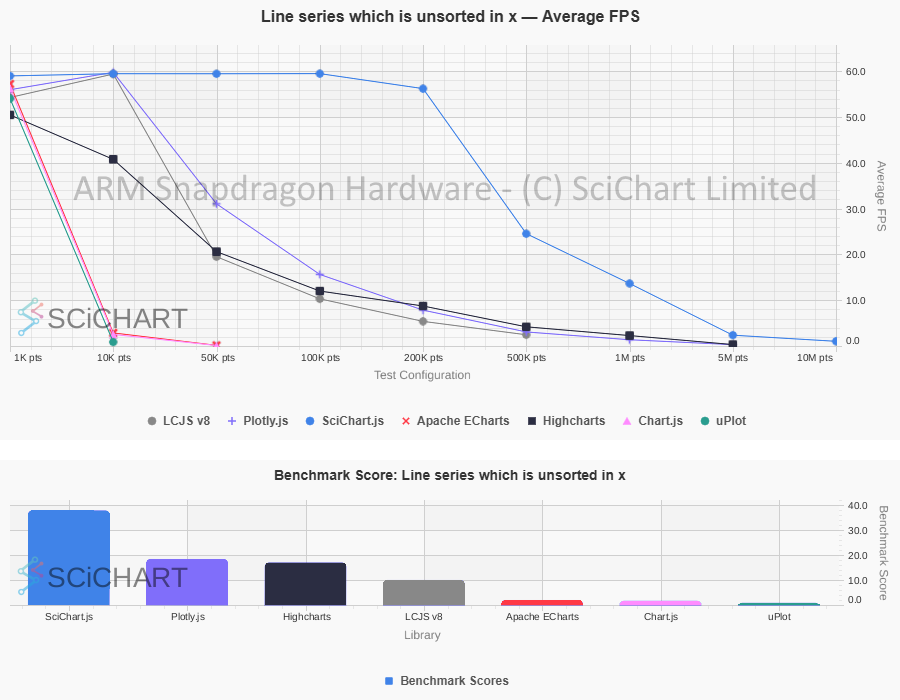
 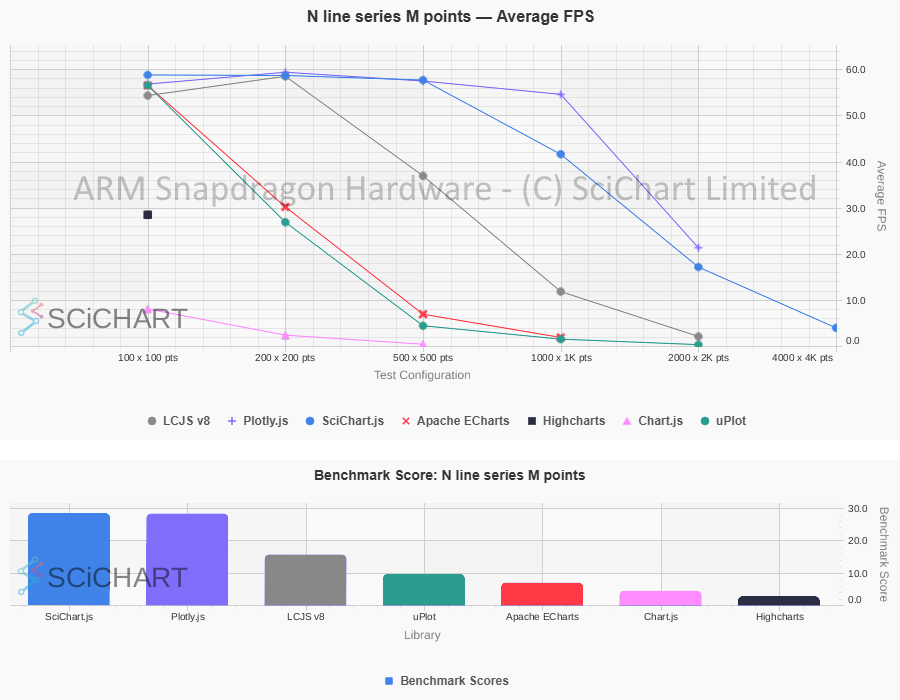 SciChart.js vs. LightningChart: N Lines x M Points Line Chart Performance on ARM Snapdragon
  SciChart.js vs. LightningChart: Real-time Scatter Chart Performance on ARM Snapdragon
 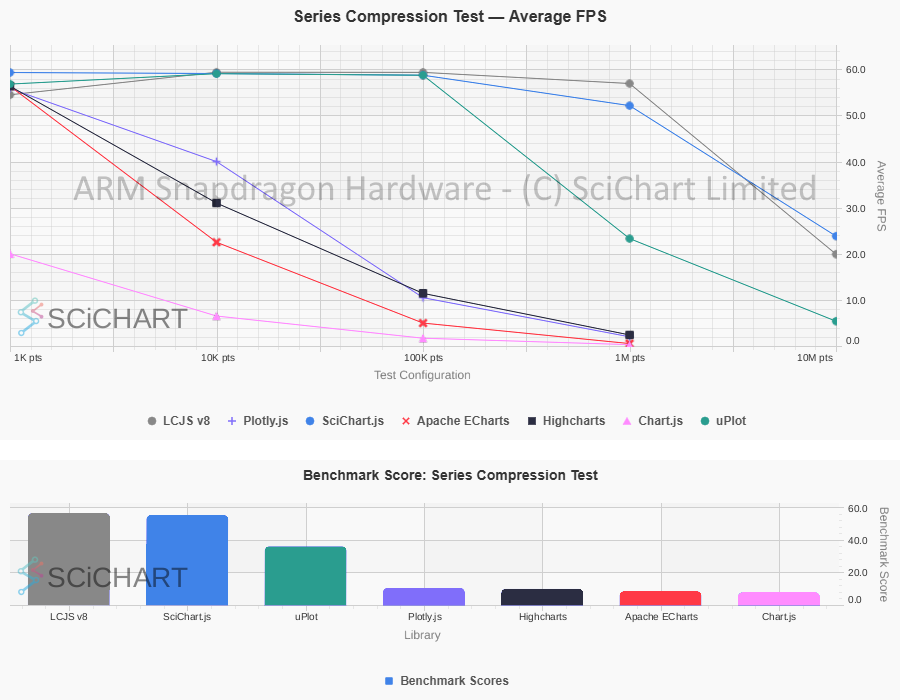 SciChart.js vs. LightningChart: Real-time Line Series Appending Performance on ARM Snapdragon
On low powered hardware, with integrated graphics, we see strong performance results for SciChart.js vs LightningChart. This is due, in part, to SciChart’s load-balancing of data processing (on the CPU using ARM Neon SIMD / Intel SSE2 SIMD) and GPU (WebGL) for final rendering. SciChart uses a hybrid approach (CPU preprocessing + GPU rendering) to balance performance across a broad range of hardware, including low-end or integrated graphics.
It’s important to note that performance test results can vary by hardware setup, and will include some noise in the measurement. Readers can reproduce the performance tests on their own PC’s and are encouraged to carry out their own due diligence before selecting a chart library.
More details how to do this can be found in the following blog post:
Learn more about SciChart's open source JavaScript Chart Performance Test suite and reproducing benchmarks … Continue reading Blog: Chart Bench: A Comprehensive Benchmark Suite to Compare JavaScript Chart Library Performances
With SciChart, the deep level of flexibility of the chart, the easy to understand and consistent API are all plus points noted by users when they try out the library.
SciChart’s API uses a plugin architecture and is designed for flexibility, in order to be customized for any use-case in enterprise analytics and dashboards. Users of SciChart continually point out the flexibility of the API as a major plus point, being able to create custom enhancements to satisfy detailed requirements in their organization.
One example of the flexibility of the API is the ChartModifier API, where specific behaviors (Zoom, Pan, Tooltip, Mousewheel, Selection) are encapsulated into classes which are attached to the chart. Users may use SciChart’s default behaviors such as ZoomPanModifier or MouseWheelZoomModifier to add panning or mousewheel behavior to a chart, but they may also create their own completely independent behaviors. Want to scroll on mouse-wheel instead of zoom? Or, perhaps you need to implement select & drag of a series or data-point? By creating a custom chartmodifier you can do this.
Another is the ability to write custom functions for custom layouts, for example, allowing unlimited configuration of axis placement (Vertically Stacked Axis API, Horizontally Stacked Axis, Custom Axis layouts) unlocking niche and challenging visualizations required by software applications in scientific and engineering sectors.
Some users also report preferring SciChart’s extensibility for advanced customization, particularly where overriding core behaviors is required.
Documentation, support and developer materials are an extremely important consideration when choosing between SciChart and LightningChart. Developers consistently rate the SciChart documentation as excellent, as well as the technical support. Choosing a chart library with excellent support materials could make a huge difference in development costs for your applications and allow you to get to market sooner, giving you a competitive advantage and helping recoup investment.
With SciChart you get:
You can learn more about our commitment to developers and support below at the following blog post. There is also more to come in the next year as we continue to invest in cutting-edge support systems and getting-started / help guides.

Learn more about how SciChart prioritises the best experience for developers, by embedding code snippets & live examples into searchable online documentation … Continue reading Blog: Documentation Snippets & Code Sandbox – Creating the best experience for JavaScript Developers
Important Note: Pricing is correct at the time of writing, and is subject to change, discounting and quoting by each individual company. Readers should do their own due diligence to ensure that libraries meet their pricing and licensing requirements before purchasing.
At the time of writing, SciChart’s published pricing for comparable packages is lower than LightningChart’s (see table below). Final pricing depends on edition, support tier, domains/apps, and commercial terms.
| SciChart 2D | SciChart 2D+3D | LightningChart 2D+3D | |
|---|---|---|---|
| Price ($) | $1,349 | $1,765 | starts from $2,750 |
| Domains / Apps | 5 | 5 | 1 |
| Support tickets | 5 | 5 | 4 |
For WPF or .NET, SciChart WPF Pricing is comparable to LightningChart WPF (single platform), however note the prices quoted on the website for LightningChart are subscription licenses (development and deployment rights expire at the end of your subscription), whereas SciChart WPF is perpetual (lifetime development and deployment rights).
| SciChart 2D | SciChart 2D+3D | LightningChart 2D Subscription | LightningChart 2D+3D Perpetual | |
|---|---|---|---|---|
| Price ($) | $1,557 (Perpetual license) | $2,180 (Perpetual license) | $1,375 (Non perpetual license) $2,745 (Perpetual) | $1,935 (Non perpetual license) $3,865 (Perpetual) |
| Support tickets | 5 | 5 | 10 | 10 |
Using the publicly listed perpetual-license tiers shown above, LightningChart pricing for .NET starts at $2,745 USD for a single perpetual developer license, covering 2D charts only. SciChart’s lowest price point for WPF charts starts at $1,557 USD for a perpetual license. The 2D/3D edition for SciChart starts at $2,180 per license, whereas LightningChart Silver package which includes 2D and 3D charts starts at $3,865.
For subscription licenses, LightningChart for .NET offers slightly cheaper pricing, but purchasers should be aware that deployment, development and end-user rights expire if the subscription is not maintained.
Further packages are available on both websites including multi-year options with discounts, options with unlimited enterprise support, and in the case of SciChart, source code.
In the blog Nanosecond Precision – how we enable SciChart to handle both High Performance and Full 64-bit precision we present a direct comparison between SciChart vs LightningChart when it comes to numeric precision and deep zoom on charts with extreme dynamic range of data.
An excerpt from the blog:
LCJS uses a
linear-highPrecisionaxis type which has adateOffsetproperty to mitigate numeric precision limits. While accepting data in BigInt64 format, the limits of precision at deep zoom are published in the docs as:
time range min interval 8 hours 10 nanoseconds 1 week 250 nanoseconds 1 year 12 microseconds Interpreted literally, this means that when operating at nanosecond-level resolution, the maximum continuous time range that can be represented without loss of precision is in the order of ~8 hours, and that the minimum resolvable interval increases as the visible range expands. This behavior is consistent with what is commonly observed in floating-point based coordinate pipelines, where precision is gradually traded for dynamic range as axis values grow larger.
By comparison, SciChart.js maintains a 64-bit time representation internally and dynamically scales the chart’s coordinate system. This design allows large time ranges and fine-grained resolution to coexist without accumulating floating-point error during zoom and pan operations. As a result, the supported ranges in SciChart.js are:
Timestamp Interval Maximum Data Range Typical Chart Resolution 1 nanosecond ~50 days ~5–10 nanoseconds 1 microsecond ~40 years ~5–10 microseconds 1 millisecond ~70,000 years ~5–10 milliseconds 1 second ~1 billion years ~5–10 seconds In practical terms, this means with SciChart, nanosecond-resolution data can be explored sparsely across weeks rather than hours, without visual instability or timestamp drift at deep zoom levels, representing a substantially higher dynamic range when visualizing data with nanosecond timestamps.
For scientific customers exploring wide dynamic ranges, this subtle but important difference may make all the difference when visualising and exploring datasets with nanosecond timestamps, or a very wide dynamic range of timestamps.
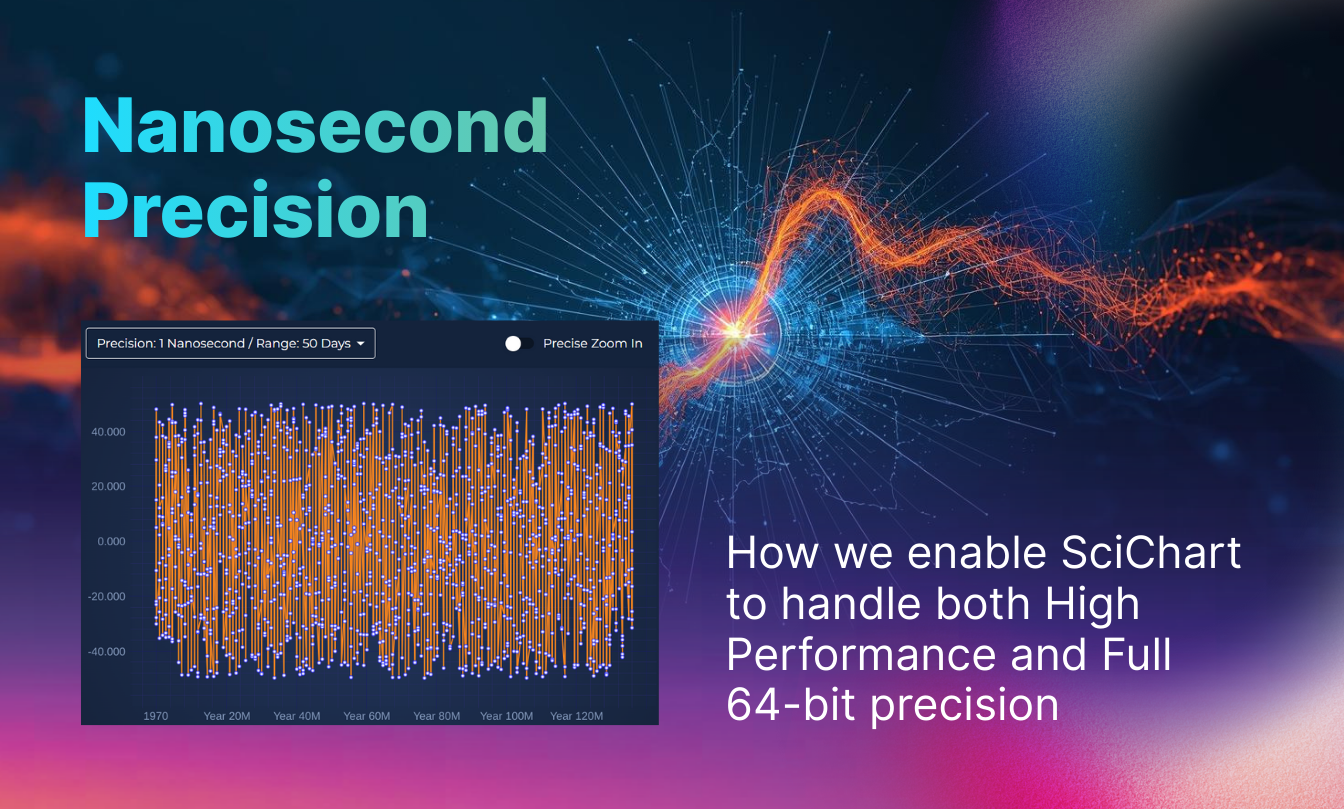
Learn more about SciChart's depth of precision and dynamic range for scientific datasets, down to millisecond, microsecond or nanosecond timestamps … Continue reading Blog: Nanosecond Precision – how we enable SciChart to handle both High Performance and Full 64-bit precision
For JavaScript
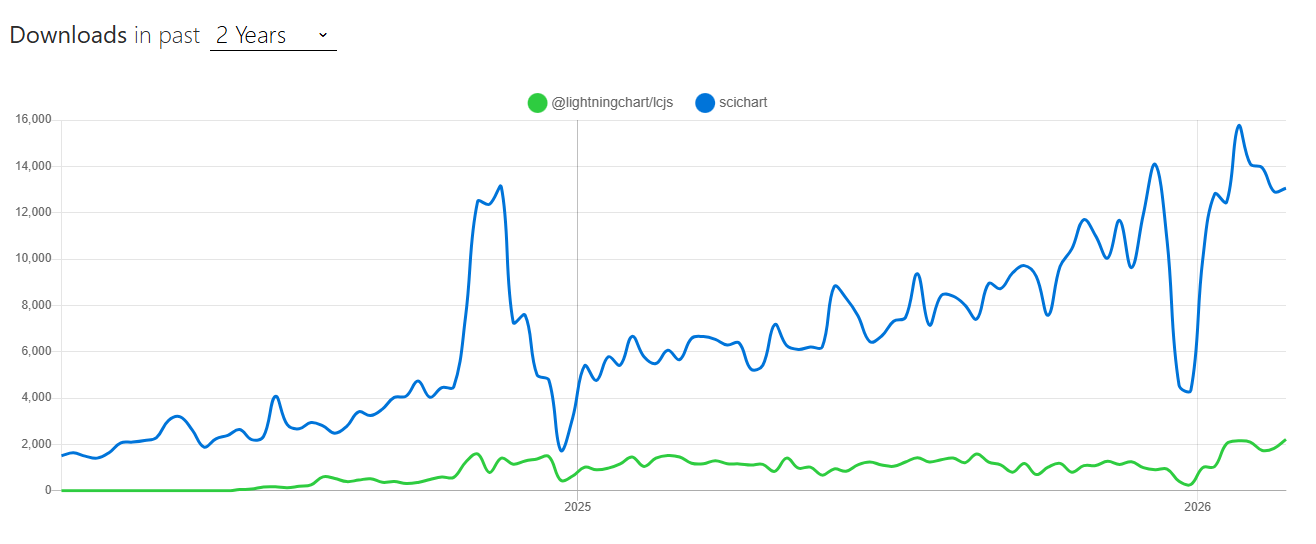
Above: Downloads past 2-years for SciChart.js vs. lcjs (source: i)
For WPF / .NET

Of the two libraries, SciChart shows higher download volume over the stated period based on npm/nuget downloads and a marginally higher update cadence. The growth of usage continues to be strong for SciChart WPF, and with accelerating adoption for SciChart JavaScript/React.
Important Note: Download stats are correct at the time of writing, and are subject to change. Readers should do their own due diligence to ensure that libraries meet their update cadence requirements before purchasing.
SciChart provides comprehensive cross-platform support, making it a versatile choice for developers and companies. It offers solutions for WPF (Desktop), JavaScript (Web), Android (native Mobile), iOS (native Mobile) macOS (Desktop) and Linux (Desktop) via Avalonia XPF.
In contrast, LightningChart focuses on .NET (Windows) and JavaScript (Web) and Python. If you need native iOS/Android or macOS targets, or are carrying out cross-platform web/mobile/embedded projects, you should confirm platform support and maintenance plans for each vendor.
SciChart provides a single, unified API across platforms: if you are familiar with the API of SciChart WPF, then the API of SciChart.js or SciChart.Android is designed to feel very familiar. With Avalonia XPF, the WPF (desktop) version of SciChart ports with 100% code compatibility to Linux. Similarly, if you have a cross-platform team that needs to produce native mobile apps (iPad, iPhone, Android) with a similar feature-set to desktop or browser apps, then a single unified API and feature-set will allow teams to share knowledge and accelerate development.
Users often compare both libraries when evaluating. So how does SciChart stack up in user reviews? We capture trusted, third-party reviews from a number of sources, including G2, Capterra and reviews.io.
The following are individual reviewer opinions (quoted), which include reviewers’ subjective views on performance, size and feature completeness, and may not reflect all users’ experiences:
“I needed to draw millions of points in my project, and nothing but SciChart could handle it. Even with a very weak GPU, the performance amazed me. It’s optimized in a truly impressive way. I didn’t know I could do all of those things on web before sci chart” – Said (source: Capterra)
“Extremely positive experience, as the component was quickly integrated into our application and we were quickly able to deliver quality solutions. SciChart 2D WPF is binding-friendly, fitting in our MVVM development pattern. It comes with great documentation and plenty of examples, allowing proficient use with little effort“ – Lorenzo (source: Capterra)
“Overall we are really happy with the product. In our eyes SciChart is the only real option for our particular use-case. Is easy to set up, really good performing and we have had great developer support the whole way. SciChart is without a doubt the best performing real time charting library. Also its the largest. Additionally the documentation is well written with lots of practical examples.” – Balin (source: Capterra)
“In general very high performance and very few bugs. Also the documentation is quite good and it is very easy for the developers to work with this product.” – Haruntyun (source: Capterra)
“I develop medical and industrial software, and I’ve found SciChart (WPF) to be a reliably performant and versatile library for real-time data display in desktop applications (scatter plots, waveform line graphs, 2D heatmaps for spectral data, and the like). I really appreciate SciChart’s performance, feature set, and MVVM support. The documentation and examples are quite thorough and customer support has always been responsive and helpful. I liked the API and documentation better than LightningChart…” – Marc (source: Capterra)
Note: The above are real-world reviews from users of SciChart. Individual experiences vary by use-case and constraints; we recommend validating against your own dataset and requirements.
In this article we’ve outlined key differences to help you evaluate SciChart vs LightningChart for your requirements. From flexibility of the API, pricing/cost, developer resources and support, to cross-platform support, popularity and performance.
In a head-to-head comparison, SciChart is highly performant for real-time and big data use cases, on a variety of mid/low and high powered hardware, has strong documentation, technical support and developer materials, is built on proprietary cross-platform technology and, based on published pricing at the time of writing, can be lower cost for comparable packages.
Both SciChart and LightningChart are high-performance libraries. Ultimately, the best choice depends on your specific platform needs, workloads and developer workflow preferences. Every project has different performance requirements, datasets, and development constraints. We hope this comparison has provided useful insights to help you weigh the options and decide what works best for your application.
Contact Us to Learn More
SciChart is a fully GPU accelerated JavaScript, React, Angular, Blazor, WPF and iOS/macOS/Android Chart Library designed for complex, mission critical data visualization applications. Now with a free community edition. If you have a question or would like to learn more about our products and services, please contact us:
Recent Blogs
![]()
Queens Award for Innovation
Proud winners of the Queens Award for Innovation, 2019. Awarded on account of our innovative graphics engine which underpins the SciChart library and enables our world-beating charting performance
![]()
National Business Awards
Highly Commended for Lloyds National Business Awards, 2019. Awarded on account of our innovative graphics engine and impressive customer base
![]()
National Technology Awards
Awarded “Healthcare Tech of the Year” at the 2025 National Technology Awards – a top UK recognition for breakthrough innovation in technology.

Reviews
SciChart has received hundreds of verified, 3rd party reviews