DirectX Compatibility in WPF Charts with SciChart
SciChart now features an optional DirectX10 based renderer. This is currently included as an add-on to the SciChart High Performance […]
The visible range of each axis can be set programmatically. As of SciChart v1.3 and above the limitation that the visible range must lie within the min, max of the data no longer applies.
The following code:
sciChartSurface.XAxis.VisibleRange = new DoubleRange(0,600);
sciChartSurface.YAxis.VisibleRange = new DoubleRange(-0.6, 1.2);
Results in this output:
 Similarly the above may be achieved in Xaml. Given a NumericAxis defined on the XAxis and YAxis properties of the SciChartSurface, the VisibleRange may be set as follows:
<SciChart:SciChartSurface.XAxis>
    <SciChart:NumericAxis>
        <SciChart:NumericAxis.VisibleRange>
            <SciChart:DoubleRange Min="0" Max="600"/>
        </SciChart:NumericAxis.VisibleRange>
    </SciChart:NumericAxis>
</SciChart:SciChartSurface.XAxis>Interactivity is provided by a number of ChartModifierBase derived classes. These are set on the SciChartSurface as follows: C#
sciChartSurface.ChartModifier = new RubberBandXyZoomModifier();
XAML
<SciChart:SciChartSurface>
   <SciChart:SciChartSurface.ChartModifier>
      <SciChart:RubberBandXyZoomModifier/>
   </SciChart:SciChartSurface.ChartModifier>
</SciChart:SciChartSurface>
This will result in the following output: 
A table of available ChartModifiers is SciChart follows:
| ChartModifier | Description | Behaviour |
| RubberBandXyZoomModifier | Draws a reticule over the screen to zoom into a location | Left click/drag: draw reticule and zoom. Setting IsXAxisOnly to true results in a horizontal only zoom |
| ZoomPanModifier | Allows the user to drag the chart surface using the mouse | Left click/drag: pans the viewable area in the X and Y direction |
| CursorModifier | Draws a crosshair on the chart and renders X,Y data values on a custom control template | Mouse move: Update crosshair location and X,Y value output |
| XAxisDragModifier | Allows the user to drag the X Axis to scale the chart | Left click/drag: Scales the X Axis depending in the mouse direction, with direction depending on the start point of the drag operation |
| YAxisDragModifier | Allows the user to drag the Y Axis to scale the chart | Left click/drag: Scales the Y Axis depending in the mouse direction, with direction depending on the start point of the drag operation |
| RolloverModifier | Gives visual feedback plus binding to detect datapoint values on mouse over | Mouse move: highlights the nearest datapoint on all series. Outputs hit test data to a collection of SeriesInfo which can be bound to |
| ZoomExtentsModifier | Allows zooming to extents on user-defined action | ZoomExtents on mouse right button up, or mouse double click depending on the value of the ExecuteOn property |
| MouseWheelZoomModifier | Allows zooming using the mousewheel | Scrollwheel: Zooms in/out a single step |
| ModifierGroup | Allows multiple modifiers to be combined and set on the SciChartSurface | N/A |
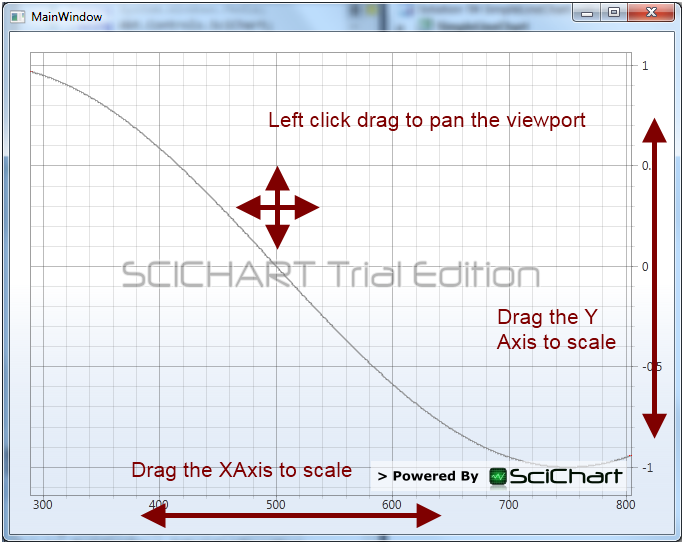
For example, to combine the X and Y Axis drag modifiers with a ZoomPanModifier, use the following code: C#
sciChartSurface.ChartModifier = new ModifierGroup(new XAxisDragModifier(),
                                       new YAxisDragModifier(),
                                       new ZoomPanModifier());
This results in the following behaviour:
Related Posts
![]()
Queens Award for Innovation
Proud winners of the Queens Award for Innovation, 2019. Awarded on account of our innovative graphics engine which underpins the SciChart library and enables our world-beating charting performance
![]()
National Business Awards
Highly Commended for Lloyds National Business Awards, 2019. Awarded on account of our innovative graphics engine and impressive customer base
![]()
National Technology Awards
Awarded “Healthcare Tech of the Year” at the 2025 National Technology Awards – a top UK recognition for breakthrough innovation in technology.

Reviews
SciChart has received hundreds of verified, 3rd party reviews