가장 빠른 차트 라이브러리로 인상적인 WPF 3D 차트 만들기
세계 최고의 WPF 3D 차트가 한층 더 진화했습니다!
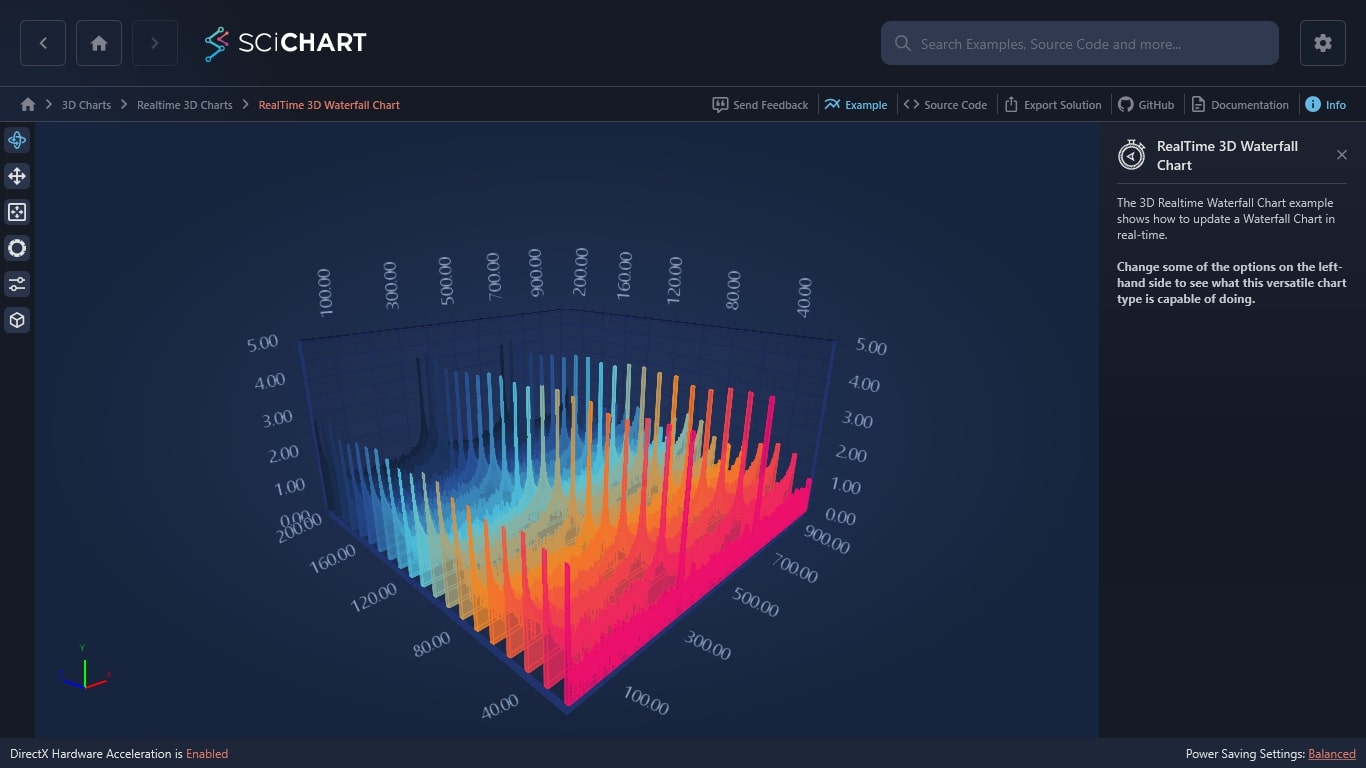
SciChart 3D for WPF는,금융, 의료, 과학 애플리케이션을 염두에 두고 개발된, 실시간 고성능 WPF 3D 차트 라이브러리입니다. 매우 높은 성능과 풍부하고 인터랙티브한 3D 차트가 필요한 프로젝트에 최적입니다.
DirectX를 탑재한WPF 3D 차트와 충실한 API를 활용하여 업무를 효율화해 보세요.
30일 무료 체험판을 이용하시면, SciChart가 귀하의WPF 3D 차트에 어떤 변화를 가져오는지 직접 확인해 보실 수 있습니다.