SciChart for Avalonia XPF v2.0 Released!
SciChart is thrilled to announce the release of SciChart for Avalonia XPF 2.0 – a major update that brings all features and improvements […]
SciChart v3.0 is here! Wait a second, what happened to SciChart v2.5 which you announced last year?
…SciChart v3.0 Is the Next Major Version
We decided that we had so many new features in our internal build and with such a long time between major releases that this should be a major update to v3.0. The core of SciChart is the same, the library should be a drop in replacement, but many internal systems have been re-architected to address long-running issues.
You can download a BETA of SciChart v3.0 now on our Downloads page.
Usage:
<s:FastLineRenderableSeries ResamplingMode="MinMaxWithUnevenSpacing"/>
Usage:
<s:FastLineRenderableSeries ResamplingMode="Auto"/>
Usage:
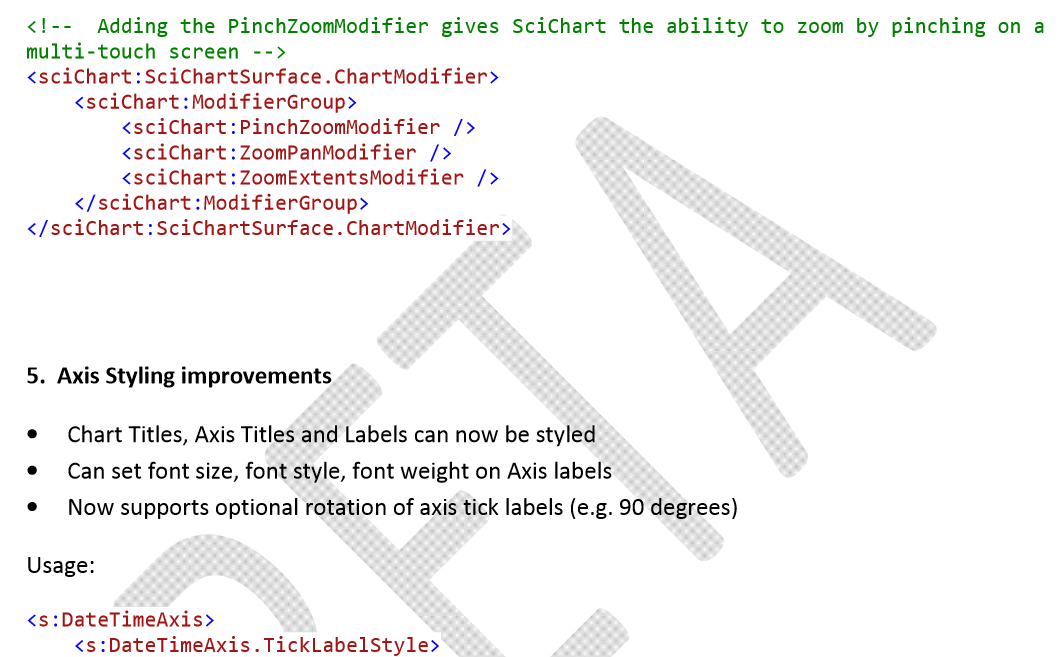
Multitouch is enabled by default in SciChart and all existing modifiers now have touch-support. To get a touch-specific pinch zoom action please use the PinchZoomModifier.
<!--  Adding the PinchZoomModifier allows zooming  -->
<!--  by pinching on a multi-touch screen -->
<s:SciChartSurface.ChartModifier>
    <s:ModifierGroup>
        <s:PinchZoomModifier />
        <s:ZoomPanModifier />
        <s:ZoomExtentsModifier />
    </s:ModifierGroup>
</s:SciChartSurface.ChartModifier>
Usage:
<s:DateTimeAxis>
    <s:DateTimeAxis.TickLabelStyle>
        <Style TargetType="s:DefaultTickLabel">
            <Setter Property="Foreground" Value="Blue" />
            <Setter Property="FontSize" Value="25" />
            <Setter Property="LayoutTransform">
                <Setter.Value>
                    <RotateTransform Angle="45" />
                </Setter.Value>
            </Setter>
        </Style>
    </s:DateTimeAxis.TickLabelStyle>
</s:DateTimeAxis>
Or
<s:NumericAxis>
    <s:NumericAxis.TickLabelStyle>
        <Style TargetType="s:NumericTickLabel">
            <Setter Property="Foreground" Value="Blue" />
            <Setter Property="FontSize" Value="25" />
        </Style>
    </s:NumericAxis.TickLabelStyle>
</s:NumericAxis>
Usage:
// Tickprovider Declaration
public class CustomTickProvider : TickProvider<DateTime>
{
    public override DateTime[] GetMinorTicks(IAxisParams axis)
    {
        return new DateTime[]
        {
            new DateTime(2014, 1, 5),
            new DateTime(2014, 1, 15),
            new DateTime(2014, 1, 25)
        };
    }

    public override DateTime[] GetMajorTicks(IAxisParams axis)
    {
        return new DateTime[]
        {
            new DateTime(2014, 1, 1),
            new DateTime(2014, 1, 10),
            new DateTime(2014, 1, 20)
        };
    }
}

// Using a TickProvider in code
var axis = new DateTimeAxis();
axis.TickProvider = new CustomTickProvider();
Or
<!-- Where CustomTickProvider is declared as a Resource -->
<s:DateTimeAxis TickProvider="{StaticResource CustomTickProvider}"/>
Usage:
<!--  Create Y Axis with IsStaticAxis flag  -->
<s:SciChartSurface.YAxes>
   <s:NumericAxis IsStaticAxis="True" />
</s:SciChartSurface.YAxes>
Usage:
<!--  Bind X and Y Axis VisibleRangeLimit to ViewModel properties  -->
<s:SciChartSurface.XAxis>
   <s:NumericAxis  VisibleRangeLimit="{Binding XLimit}"/>
</s:SciChartSurface.XAxis>

<s:SciChartSurface.YAxis>
   <s:NumericAxis VisibleRangeLimit="{Binding YLimit}"/>
</s:SciChartSurface.YAxis>
// Viewmodel properties declared as
private DoubleRange _xLimit;

public DoubleRange XLimit
{
    get { return _xLimit; }
    set
    {
        if (_xLimit == value) return;
        _xLimit = value;
        OnPropertyChanged("XLimit");
    }
}

private DoubleRange _yLimit;

public DoubleRange YLimit
{
    get { return _yLimit; }
    set
    {
        if (_yLimit == value) return;
        _yLimit = value;
        OnPropertyChanged("YLimit");
    }
}
Usage:
// Use this code to Serialize just annotations
private string SerializeAnnotations(AnnotationCollection annotationCollection)
{
    var stream = new MemoryStream();
    var serializer = new XmlSerializer(typeof (AnnotationCollection));
    serializer.Serialize(stream, annotationCollection);

    stream.Position = 0;
    string xmlText = new StreamReader(stream).ReadToEnd();
    return xmlText;
}

// Use this code to Deserialize just annotations
private AnnotationCollection DeserializeAnnotations(string xmlText)
{
    var stream = new MemoryStream(Encoding.ASCII.GetBytes(xmlText));
    var serializer = new XmlSerializer(typeof(AnnotationCollection));

    stream.Position = 0;
    var annotationCollection = (AnnotationCollection) serializer.Deserialize(stream);
    return annotationCollection;
}
// Use this code to Serialize/Deserialize a SciChartSurface
private void SerializeChart()
{
    var beforeChart = new SciChartSurface();
    // ...
    var stream = new MemoryStream();
    var serializer = new XmlSerializer(typeof(SciChartSurface));
    serializer.Serialize(stream, beforeChart);

    var afterChart = (SciChartSurface)serializer.Deserialize(stream);

}
Usage:
sciChartSurface.MaxFrameRate = 24;
Or
<SciChart:SciChartSurface MaxFrameRate="24">
Usage:
var surface = new SciChartSurface();
//...

// Export to in-memory bitmap
var bitmapSource = surface.ExportToBitmapSource();

// Export directly to file
surface.ExportToFile("Filename.png",ExportType.Png);
Usage:
<s:SciChartSurface.RenderableSeries>
    <s:FastHeatMapRenderableSeries x:Name="heatmapSeries"
                                    Opacity="0.5"
                                    Maximum="200">
        <!-- Defining the Color Map using WPF LinearGradientBrush -->
        <s:FastHeatMapRenderableSeries.ColorMap>
            <LinearGradientBrush>
                <GradientStop Offset="0" Color="DarkBlue" />
                <GradientStop Offset="0.2" Color="CornflowerBlue" />
                <GradientStop Offset="0.4" Color="DarkGreen" />
                <GradientStop Offset="0.6" Color="Chartreuse" />
                <GradientStop Offset="0.8" Color="Yellow" />
                <GradientStop Offset="1" Color="Red" />
            </LinearGradientBrush>
        </s:FastHeatMapRenderableSeries.ColorMap>
        <!-- Defining the RolloverMarkerTemplate for use with Rollover -->
        <s:FastHeatMapRenderableSeries.RolloverMarkerTemplate>
            <ControlTemplate>
                <s:TemplatableControl>
                    <s:TemplatableControl.ContentTemplate>
                        <DataTemplate>
                            <Ellipse Width="9"
                                    Height="9"
                                    Fill="Red"
                                    Stroke="Blue"
                                    StrokeThickness="2" />
                        </DataTemplate>
                    </s:TemplatableControl.ContentTemplate>
                </s:TemplatableControl>
            </ControlTemplate>
        </s:FastHeatMapRenderableSeries.RolloverMarkerTemplate>
    </s:FastHeatMapRenderableSeries>
</s:SciChartSurface.RenderableSeries>
<!-- Defining the Heatmap Legend -->
<s:HeatmapColourMap Margin="30" HorizontalAlignment="Left" VerticalAlignment="Top"
                    FastHeatMapRenderableSeries="{Binding ElementName=heatmapSeries, Mode=OneWay}"
                    Opacity="0.5"
                    Orientation="Vertical" />
/// <summary>
///     An interface to a subset of methods on the SciChartSurface.
/// </summary>
public interface ISciChartController : ISuspendable, IInvalidatableElement
{
    /// <summary>
    /// Zooms the chart to the extents of the data, plus any X or Y Grow By fraction set on the X and Y Axes
    /// </summary>
    void ZoomExtents();

    /// <summary>
    /// Zooms to extents with the specified animation duration
    /// </summary>
    /// <param name="duration">The duration of animation when zooming to extents</param>
    void AnimateZoomExtents(TimeSpan duration);

    /// <summary>
    /// Zooms the chart to the extents of the data in the Y-Direction, accounting for the current data in view in the X-direction
    /// </summary>
    void ZoomExtentsY();

    /// <summary>
    /// Zooms the chart to the extents of the data in the Y-Direction, accounting for the current data in view in the X-direction
    /// </summary>
    void AnimateZoomExtentsY(TimeSpan duration);

    /// <summary>
    /// Zooms the chart to the extents of the data in the X-Direction
    /// </summary>
    void ZoomExtentsX();

    /// <summary>
    /// Zooms the chart to the extents of the data in the X-Direction
    /// </summary>
    void AnimateZoomExtentsX(TimeSpan duration);
}
Usage:
With great power comes great responsibility! Every release of SciChart has more features, more bugs fixed, and therefore more potential to be slower than the last. In SciChart v3.0 we have made slight but important improvements to performance by:
We aim to keep working in this area and like a race car, shave off the extra milliseconds wherever we find them!
Head over to www.scichart.com/downloads where you can download the BETA installer, or as DLLs only. Both packages also include a PDF Release note with the above changes and some upgrade instructions for existing users.
Source code customers, we will be sending out an update soon via email.
Related Posts
![]()
Queens Award for Innovation
Proud winners of the Queens Award for Innovation, 2019. Awarded on account of our innovative graphics engine which underpins the SciChart library and enables our world-beating charting performance
![]()
National Business Awards
Highly Commended for Lloyds National Business Awards, 2019. Awarded on account of our innovative graphics engine and impressive customer base
![]()
National Technology Awards
Awarded “Healthcare Tech of the Year” at the 2025 National Technology Awards – a top UK recognition for breakthrough innovation in technology.

Reviews
SciChart has received hundreds of verified, 3rd party reviews