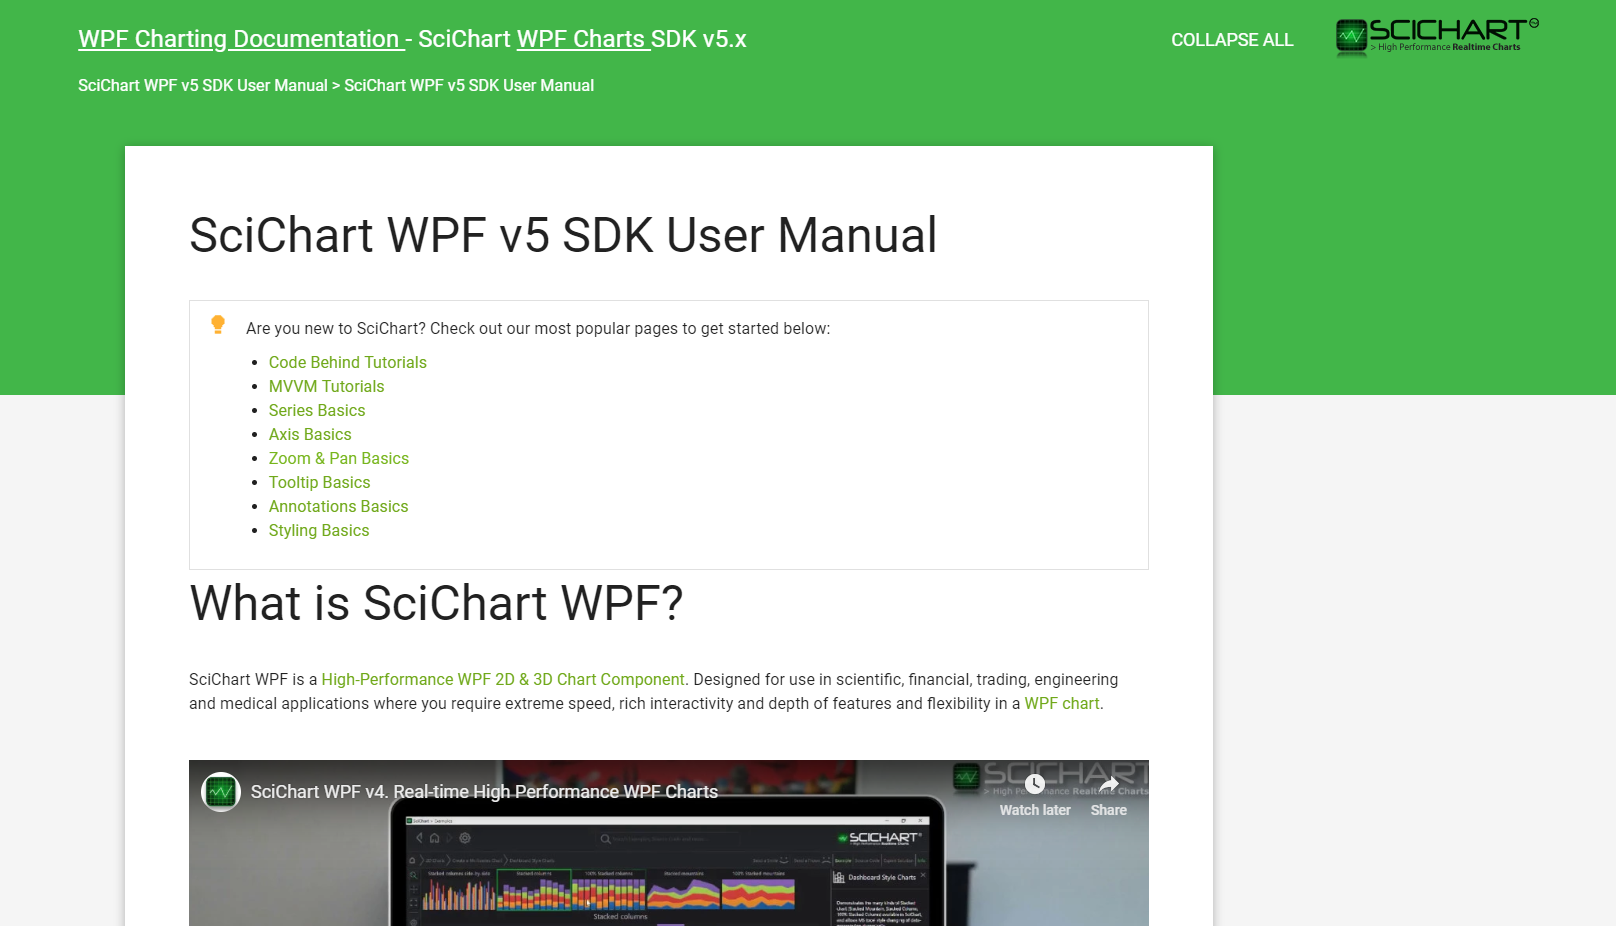
As part of ongoing work to improve the user-experience for our customers, we have just quietly rolled out improvements to our documentation for WPF Charts, iOS Charts & Android Charts.
Changes include:
- A brand new stylish theme in SciChart Green!
- Easier to read pages with cleaner styles.
- Responsive output for mobile & tablet devices.
- Many small corrections and improvements to the documentation.
- Making it easier to find information via Google using Title tags and structured data.
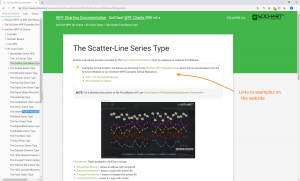
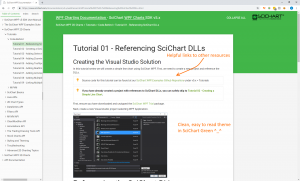
You can check out the documentation for our iOS Charts, Android Charts and WPF Charts here:
SciChart’s Charts have hundreds of hand-written documentation pages across our platforms, as well as thousands of automatically generated pages from actual .NET/Xamarin assemblies, Java libraries, and iOS Frameworks.
By creating documentation which is easy to read, easy to search, we believe it will make your day more productive as you work with SciChart. All of our documentation is online, and indexable & searchable via Google. Just try now googling for something like ‘SciChart RolloverModifier Custom Tooltip‘. There’s a high probability you will find the information you need!
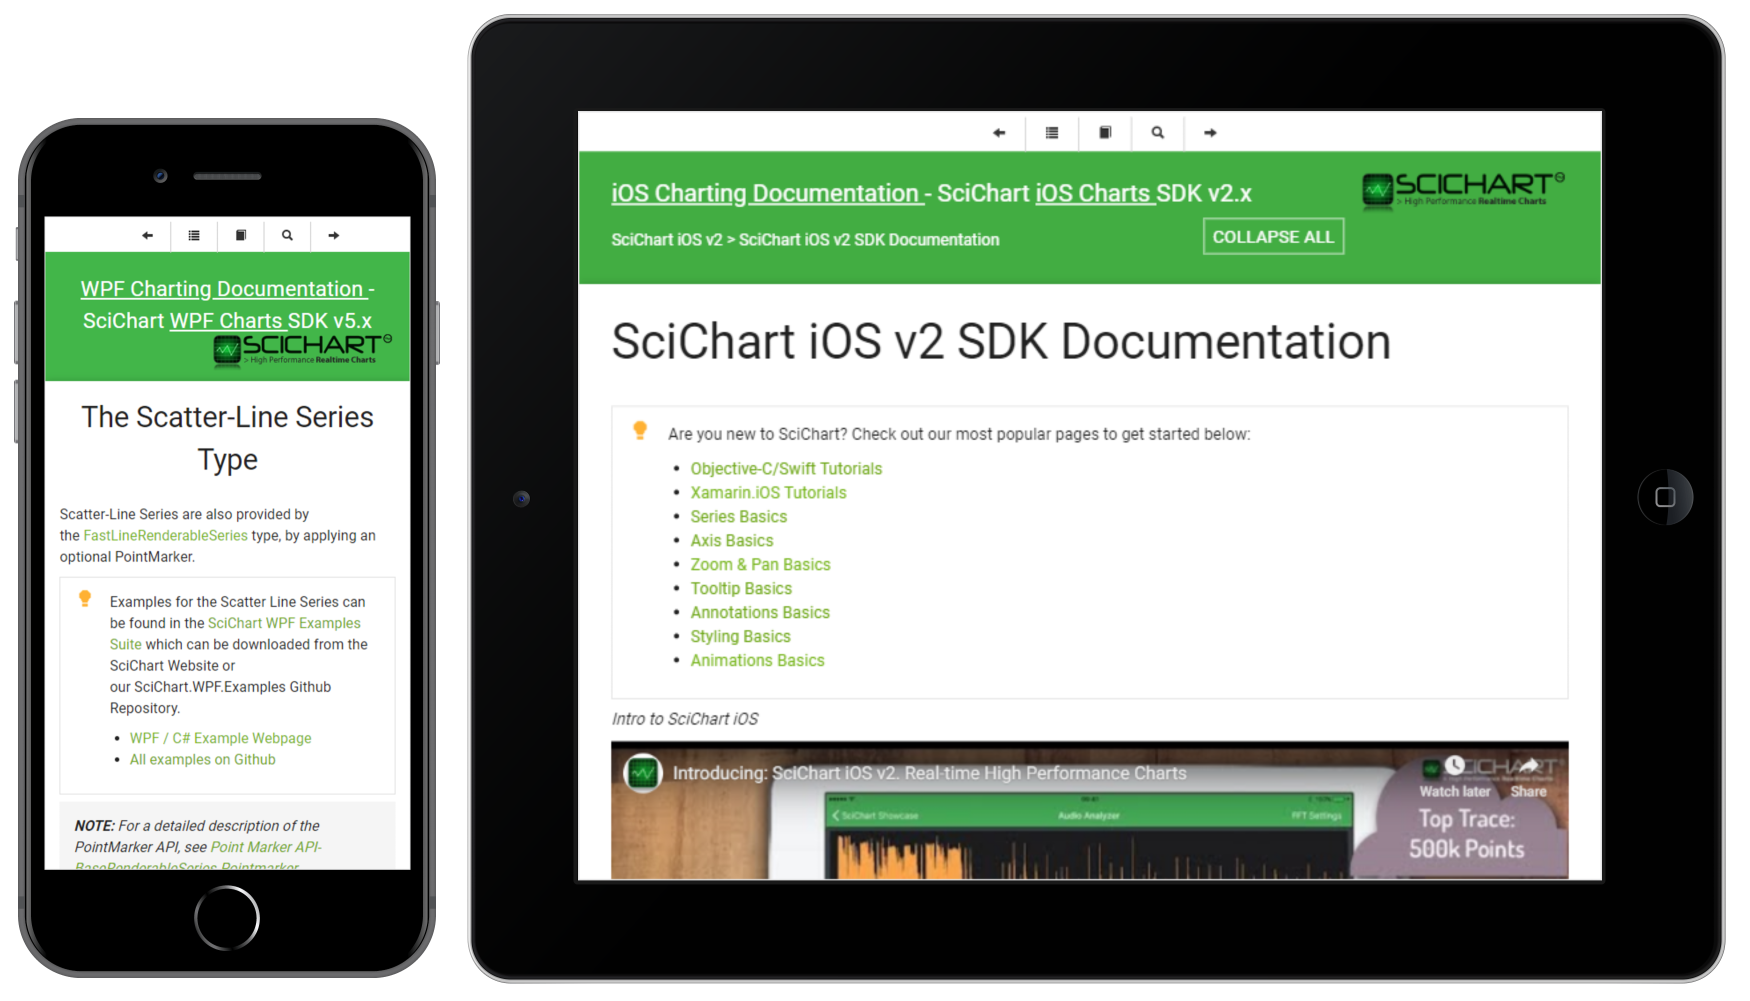
Responsive design for tablet & mobile now means you can view our chart documentation on your favourite device[/caption]
More improvements on the way
We’ve recently delivered automatic search of the forum as you type questions, and more improvements are on the way soon, such as a feature-request voting system, and intelligent search as you open support tickets.
Watch this space!
Best regards,
[SciChart Team]
Related Posts
