DirectX Compatibility in WPF Charts with SciChart
SciChart now features an optional DirectX10 based renderer. This is currently included as an add-on to the SciChart High Performance […]
Hey everyone!
Even though the release of SciChart WPF v4.2 is barely a day old(!) we are already hard at work on v4.3, where we intend to add some new features for SciChart WPF 3D Charts as well as several 2D Chart features. We want to get some information from you, our userbase, as to what requirements are most important to you. We also need to ask you a few questions about how you would expect correct usage of the 3D Chart.
We are planning the following features for v4.3 of SciChart WPF and we need your feedback on them. Some questions and explanation are found below.
We can add contours on surface plots quite easily. Something like this:

This is quite easy to do, but we would like to know from you if (a) it is important, (b) you need to be able to configure the contour colours dynamically (per contour, as opposed to one colour for all), (c) whether you have any special requirements for placing contours, or if you would like SciChart to choose and (d) any other comments or suggestions for the API as we build it.
Can you contact us if this feature is important to you? Your input into the requirements would be greatly appreciated.
A number of users have asked for nulls (transparent cells) in surface meshes. This sounds easy on the surface, but it isn’t … Nevertheless we want to deliver it. We do have some questions though.
Given a surface mesh with 8×8 data values, we end up with something like this (below). The data-points are shown by orange dots. The cells are the squares next to the dots.
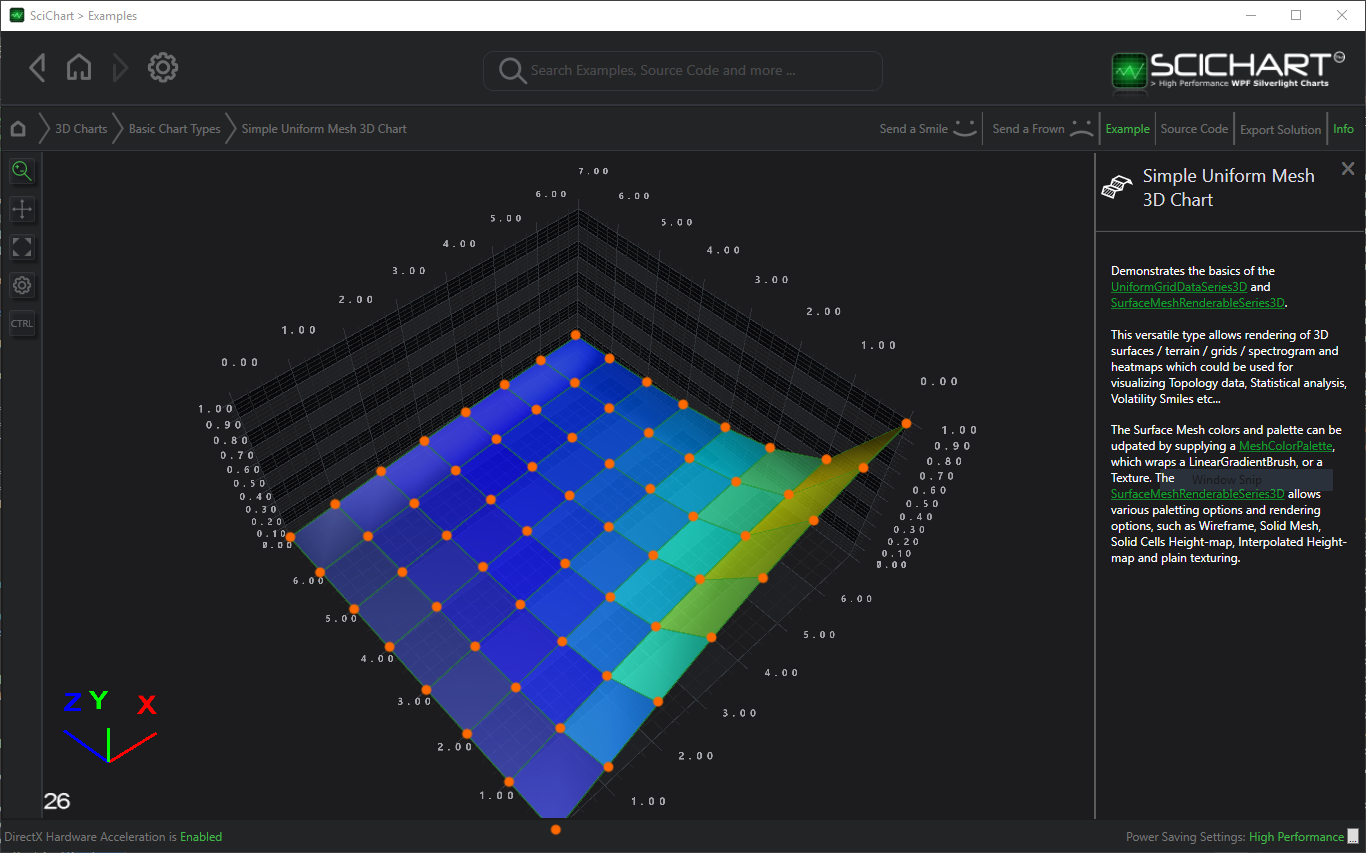
As you can see, cell colour is specified by interpolating the four points surrounding a cell. For example, the cell in the top right has a data-value of Y=1 so it should be red, but it isn’t, it’s yellow, because it has two other edges which are only at Y=0.5.
Now if a user wants to specify a cell as transparent, for example the cell at X=1, Z=6, them you end up with this:
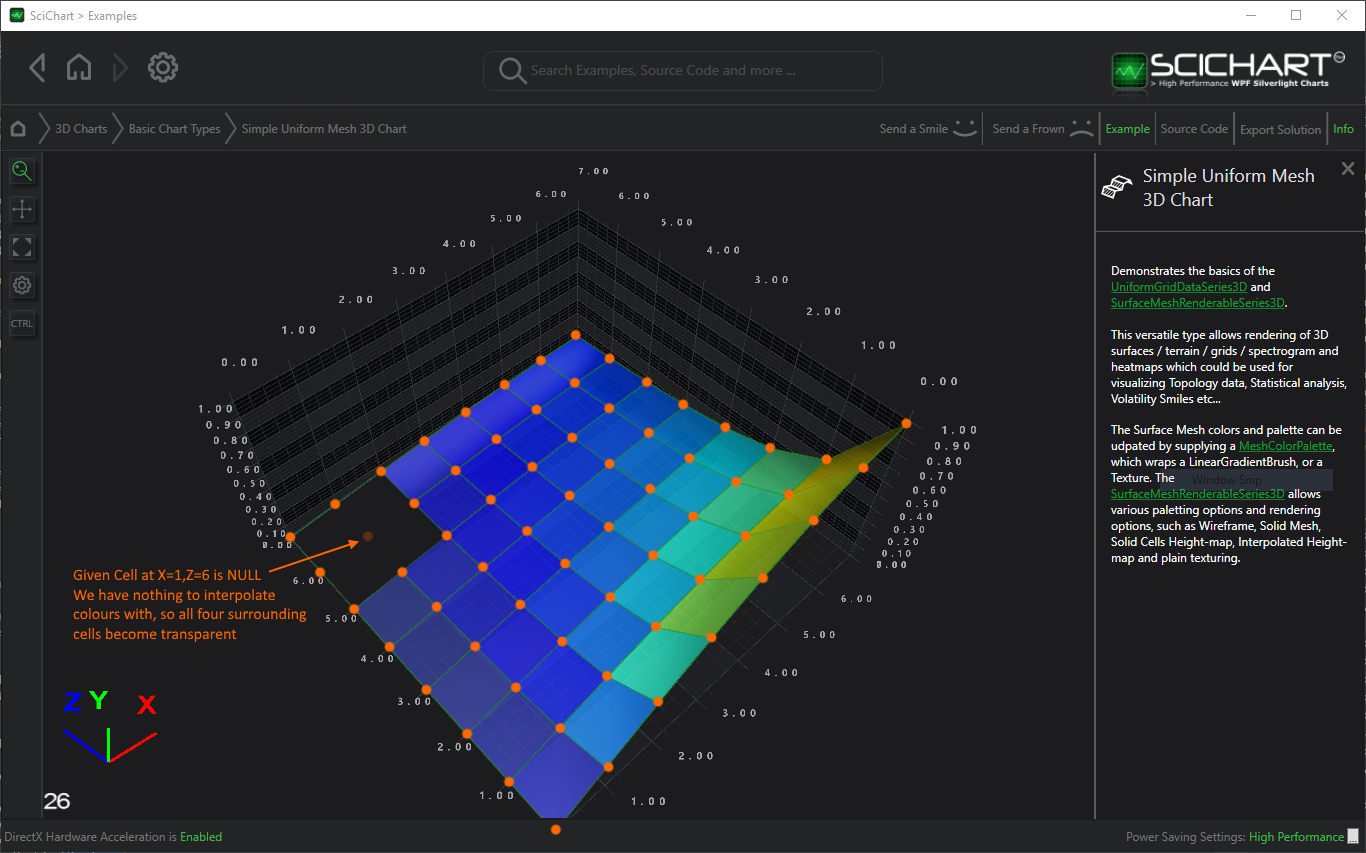
Now this obviously isn’t ideal. We thought about how to solve this.
We could allow you to specify a separate texture for the mask to ‘null’ certain cells, however you will notice that there are 8×8 data-points in the mesh, but only 7×7 cells, so the texture size doesn’t actually match the data size. This would allow you to mask out certain cells but it would also give you a clunky API and raise questions of accuracy because of the mismatch of sizes.
Another way is we could change how we are drawing the cell textures. We could offset the texture so that each square in the texture surrounds the data-point, for example:
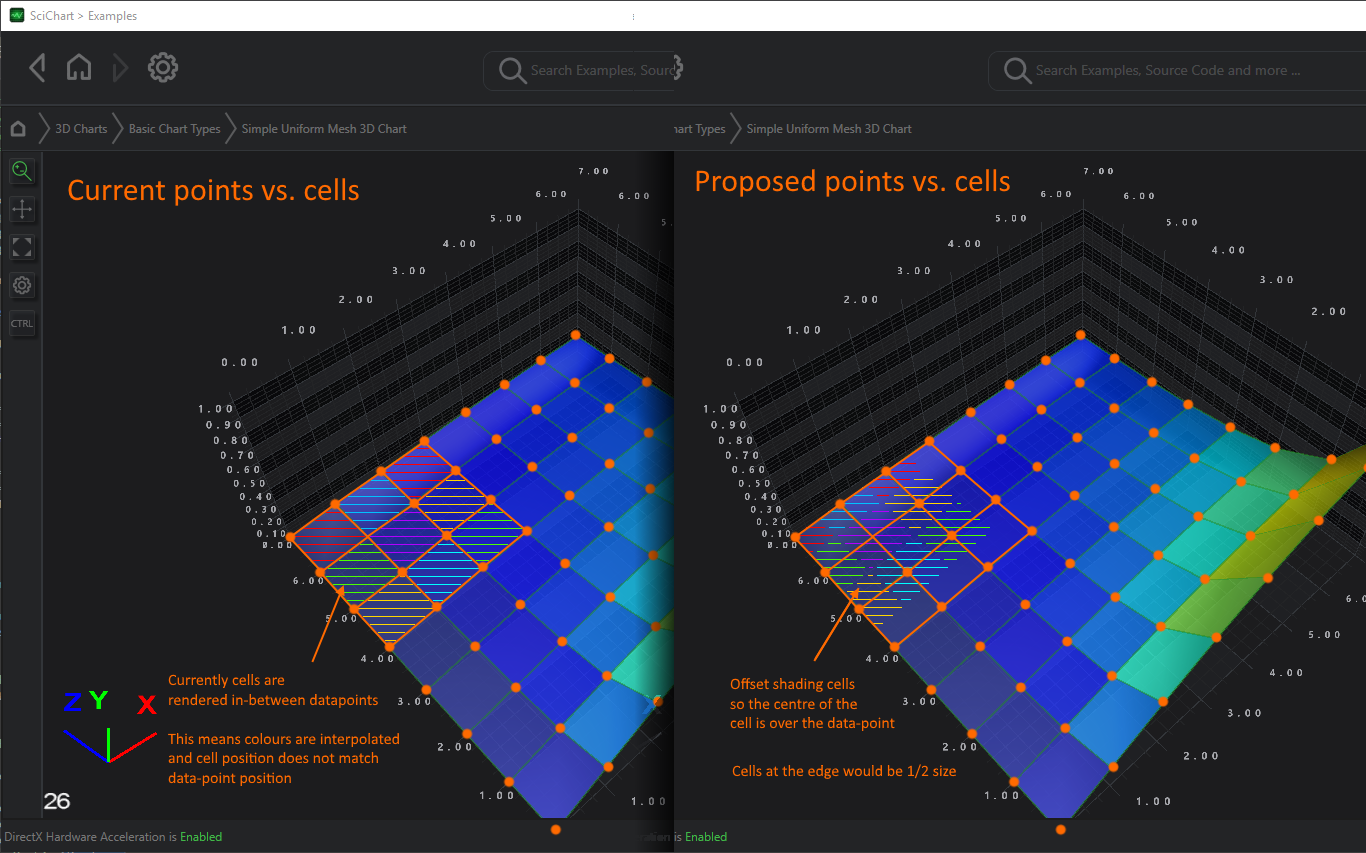
This would be a nice solution except it raises two problems.
We invite your comment/feedback on this proposed solution and whether it seems correct. It is very important to us that our scientific WPF Charts are both intuitive and accurate.
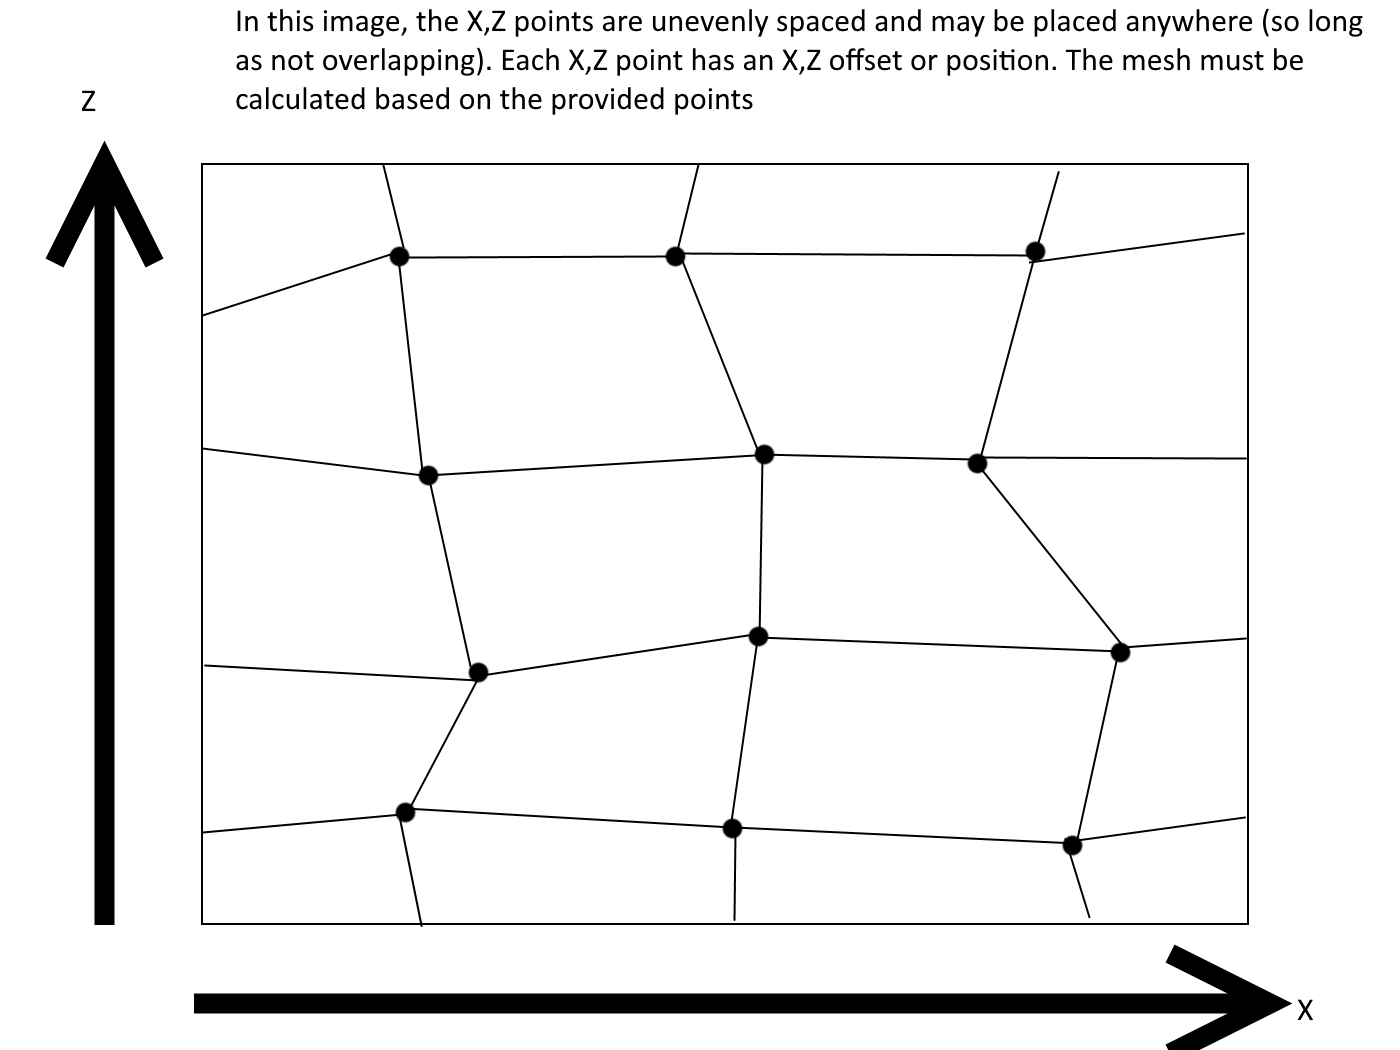
Several users have requested that we allow uneven spacing of surface mesh data-points. However, we have a question. Which sort of spacing are you expecting, (A) or (B)?

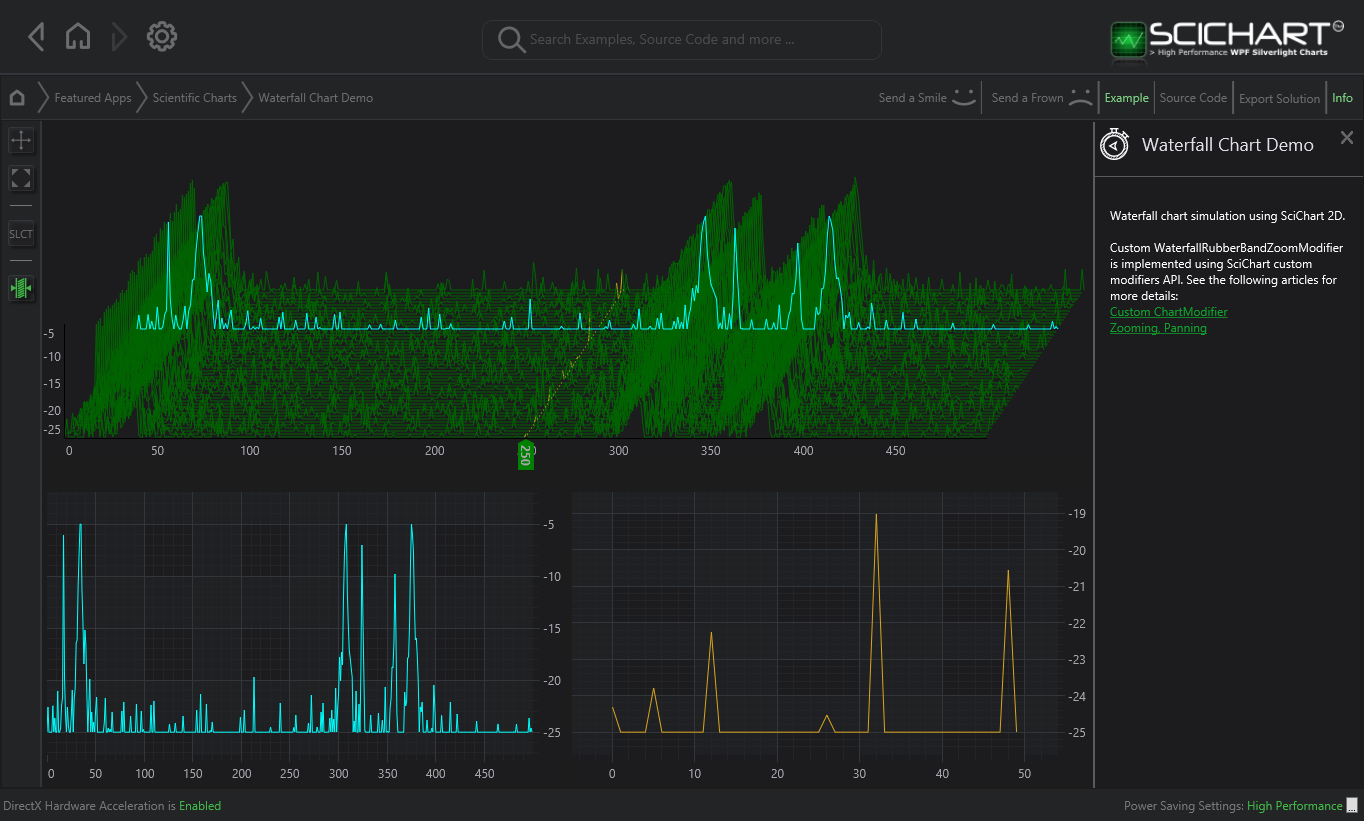
In SciChart WPF v4.3 we intend to add Waterfall Charts 3D. For clarification, we intend to create a hardware-accelerated version of our WPF Waterfall Chart Example using SciChart3D:
If we do this, we will likely bind it to our UniformGridDataSeries3D type. This means the data-source will be a 2-dimensional Double[][] array of Y-values only. But what sort of requirements do you need for this chart type? Do you need for example:
We’re assuming you need realtime performance & being able to scroll in the Z-direction (time) …
The current limit for the size of the 3D Surface Mesh chart is limited by the maximum texture size on your GPU, which in most cases is 4096*4096 and on some GPUs is larger, up to 16k * 16k.
Some customers have contacted us and asked for larger surface sizes, but we would just like to know how many so that we can prioritise this complex piece of work.
Those are all the questions we have about SciChart 3D Surface Mesh for now. If you are a current customer of SciChart WPF 3D, or you are considering to purchase this software, please get in contact with your feedback. It is extremely valuable that we build software that you actually want to use and meets your requirements!
Best regards,
[SciChart Team]
Related Posts
![]()
Queens Award for Innovation
Proud winners of the Queens Award for Innovation, 2019. Awarded on account of our innovative graphics engine which underpins the SciChart library and enables our world-beating charting performance
![]()
National Business Awards
Highly Commended for Lloyds National Business Awards, 2019. Awarded on account of our innovative graphics engine and impressive customer base
![]()
National Technology Awards
Awarded “Healthcare Tech of the Year” at the 2025 National Technology Awards – a top UK recognition for breakthrough innovation in technology.

Reviews
SciChart has received hundreds of verified, 3rd party reviews