SciChart for Avalonia XPF v2.0 Released!
SciChart is thrilled to announce the release of SciChart for Avalonia XPF 2.0 – a major update that brings all features and improvements […]
Preview! The following article was a preview of the Annotations API in SciChart v1.5 Premium Edition when it was in Beta. The full trial version of v1.5 can be downloaded now at www.scichart.com/downloads
The SciChart team is back from summer vacations and gearing up for an exciting Autumn with new features & examples for you all. First of all we’d like to welcome you back from the summer and hope that you had good times with family & friends. We’d also like to thank our userbase who have been providing great feedback in the forums and via email. If you haven’t used our forums yet, please feel free to contribute! I hope that you will be pleasantly surprised by the speed and professionalism at which our team addresses your issues.

When SciChart v1.0 was released back in early 2012, we admit, it was rather basic. Since then it has come on in leaps & bounds! We want to thank our valued customers who have adopted SciChart since Launch. We want to continue to serve you and ensure that SciChart adds value to your business.
With the release of SciChart v1.5 we will be announcing SciChart Premium Edition. This will include certain features which will only be available to Premium Edition customers. The Premium Edition will incur a price rise over SciChart Standard for new customers (to be decided). To thank to our early adopters, all our existing customers who have already licensed SciChart will be automatically upgraded to Premium for the remainder of their 1-year support contract.
Until now, SciChart has had basic support for annotations by manually placing UIElements on the ModifierSurface. In SciChart v1.5 we have built out a full annotations API:


We’ve received a lot of interest from financial users who want to use SciChart in trading applications, but as yet SciChart is not ready to meet their needs.
This is our aim – to become a market-leader in scientific & financial charting on the WPF/Silverlight and WinRT platforms, so the past quarter we have been working to address shortfalls in the trading chart features of SciChart.
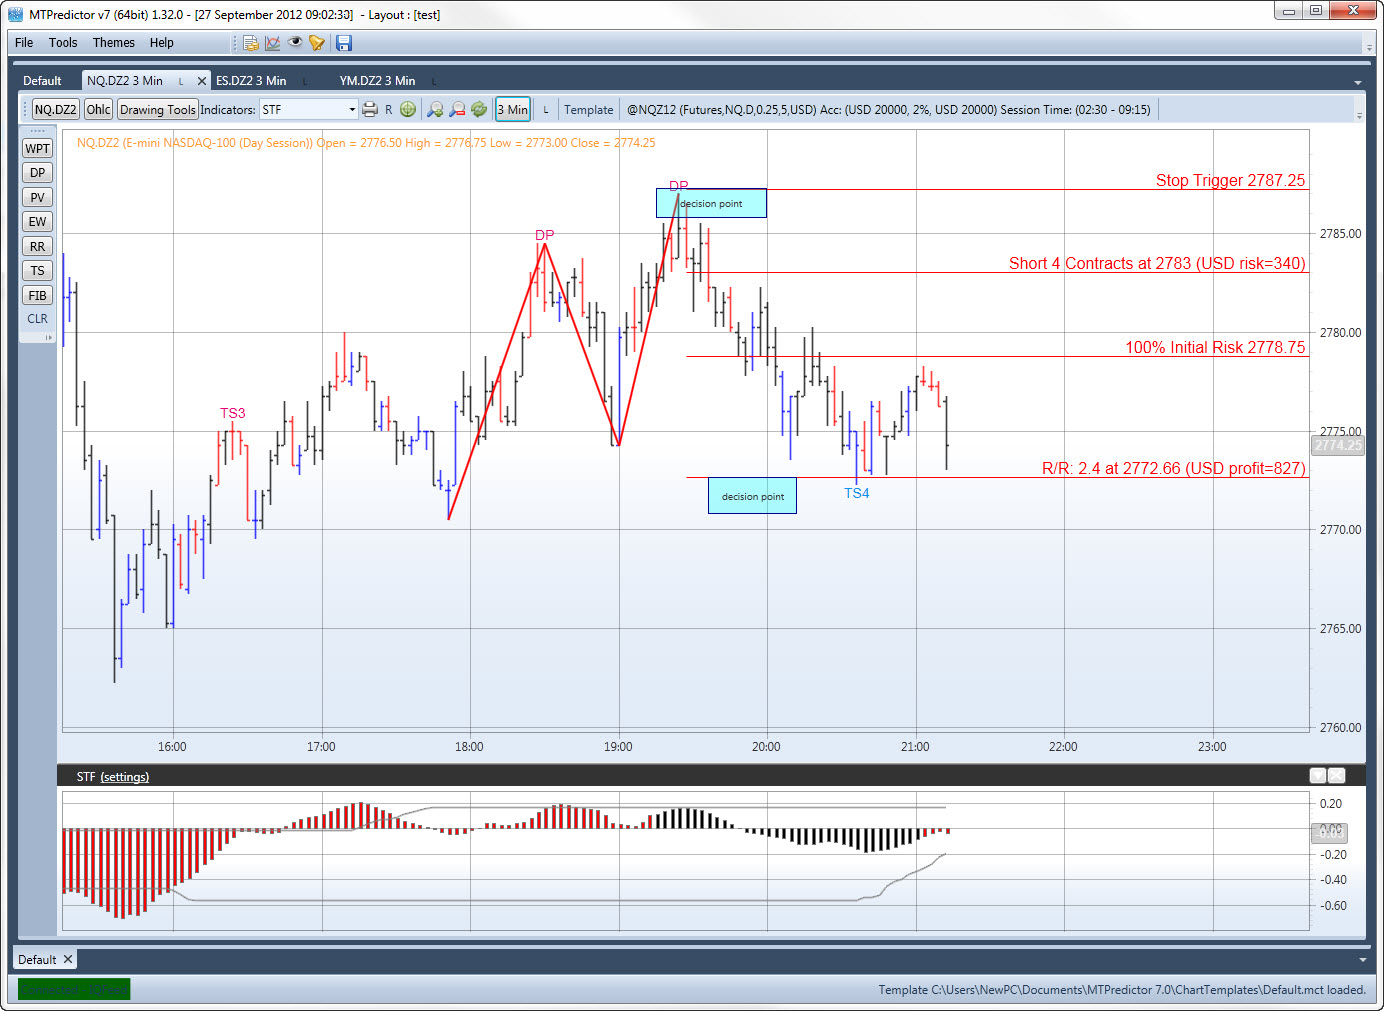
We have been providing working with a UK-based trading platform provider, MT Predictor, to provide charting capabilities to v7.5 of their software. As a result, v1.5 will have a host of features which will propel SciChart into a leading position to provide WPF / Silverlight stock charts. Check out some of the incredible screenshots of MT Predictor v7.5 Beta (powered by SciChart) below!

A hotly requested feature is the ability to dynamically color a bar or candle depending on data-point value. SciChart v1.5 will allow you to register an IPaletteProvider derived type on a RenderableSeries to override the Color of an OHLC bar, Candle or Column of a specific data-point.

SciChart v1.3 has had many problems reported in its CategoryDateTimeAxis. Namely, the inability to scroll past the end of the data-series, inconsistent zooming & panning and errors with ticks / axis labels when including irregular data, such as hourly/minute bars with weekends, or tick/range bars.
These issues have been addressed with a complete re-write of the CategoryDateTimeAxis. It’s now a bespoke axis type for trading charts so has been renamed -> TradeChartDateTimeAxis.
In addition, we’ve created the TradeChart control, which allows you to stack indicator panes below a price pane, or arrange them as tabs. TradeChart and TradeChartDateTimeAxis will only be available in the Premium Edition of SciChart.


The DataSeries API has undergone a refactor to cope with future requirements of SciChart. We have taken our basic DataSeries API (which looks like this):
var dataSeries = new DataSeries<DateTime, double>();
dataSeries.Append(x, y); // Append xy
dataSeries.Append(x, open, high, low, close); // or OHLC
… and modified it to remove the Append overload. Now there’s just DataSeries.Append(x,y). So, how do you add OHLC data you ask? By using an OhlcDataSeries:
// Declare dataset and two series, one for Xy data and the other for Ohlc data
var dataSeriesSet = new DataSeriesSet<DateTime, double>();
var dataSeries = new XyDataSeries<DateTime, double>();
var ohlcDataSeries = new OhlcDataSeries<DateTime, double>();
// Add to the DataSet, note DataSeriesSet.AddSeries() now only returns an XyDataSeries
dataSeriesSet.Add(dataSeries);
dataSeriesSet.Add(ohlcDataSeries);
// Append data
dataSeries.Append(x, y);
ohlcDataSeries.Append(x, open, high, low, close);
The above provides an intuitive way to add multi-dimensional data to a data-series. In future releases we will be extending this API to provide other IDataSeries derived types, in order to allow a host of features such as Fan charts, Band charts, Heatmaps etc…
Series Selection in SciChart v1.3 used the HitTest API. You may recall the API is something like this:
var hitTestInfo = myRenderableSeries.HitTest(e.MousePoint);
if (hitTestInfo.IsHit)
{
   // series was hit, select
   myRenderableSeries.IsSelected;
}
Those of you who have used the above will know that the hit-test only returns IsHit == true when a data-point has been clicked. In SciChart v1.5 we have added an overload to allow interpolation. This will have the effect of hit-testing on the line, or on the candle body for Candlesticks, on the area for Mountain, Column charts and on the vertical line for OHLC and Impulse charts.
bool interpolate = true;
var hitTestInfo = myRenderableSeries.HitTest(e.MousePoint, interpolate);
if (hitTestInfo.IsHit)
{
   // series was hit, select
   myRenderableSeries.IsSelected;
}
As part of our work to improve the DataSeries API, we have included a new RenderableSeries type – BandSeries. The BandSeries accepts an XyyDataSeries as data source, which has Y0 and Y1 values for each X value. The Band Series renders two lines and a shaded area between the lines depending on whether Y0 > Y1 or vice versa. Check out the screenshot below!

Currently a work in progress, we are addressing issues reported in the forums of synchronising DataSeries and RenderableSeries. We’re planning to address the issue with minimal impact to existing users of the DataSeries API, but maximum ease of developing applications with SciChart.
SciChart v1.5 will feature an improved cursor, which can be used right out of the box via the themes to place axis labels on the chart at the cursor position. That’s not all, we’ve included multiple bug fixes (too many to mention) which haven’t made it into the v1.3.* branch.
Plenty more examples are on the way, and some long overdue tutorials! We will be creating examples for Annotations, Annotations using MVVM, interactive annotations, Add/Remove Series, Changing RenderableSeries type, MVVM series binding, TradeChart control and more! …
At release time we will also be making some minor changes to our terms & conditions and licensing model. We intend to implement a 30-day trial mechanism with activation per-machine on both Standard and Premium editions of SciChart. You will still have the ability to redistribute SciChart royalty free without the need for an internet connection to activate, but at install time, developer licenses will need to have a one-time activation against our licensing server in order to be used in Visual Studio 2010. If you believe you may have the incorrect number of licenses, please contact sales and we will be happy to assist you with a licensing upgrade prior to the release date to minimise migration issues.
Related Posts
![]()
Queens Award for Innovation
Proud winners of the Queens Award for Innovation, 2019. Awarded on account of our innovative graphics engine which underpins the SciChart library and enables our world-beating charting performance
![]()
National Business Awards
Highly Commended for Lloyds National Business Awards, 2019. Awarded on account of our innovative graphics engine and impressive customer base
![]()
National Technology Awards
Awarded “Healthcare Tech of the Year” at the 2025 National Technology Awards – a top UK recognition for breakthrough innovation in technology.

Reviews
SciChart has received hundreds of verified, 3rd party reviews