SciChart for Avalonia XPF v2.0 Released!
SciChart is thrilled to announce the release of SciChart for Avalonia XPF 2.0 – a major update that brings all features and improvements […]
After what feels like a very long wait, SciChart v3.0 the release is finally here!! We’ve been through two intensive Beta cycles to bring you this and SciChart v3.0 is packed with new features, bug fixes and enhancements that will take your charting applications to the next level.
Some of you have asked why the wait, is something wrong? Well, we only like to release software that is of high quality, and not before its ready. We have many many users that we don’t want to disappoint. So, we’ve refined and refined again so that SciChart v3.0.2 is a product we are happy to put our names against, and there’s much more to come in minor updates too.
So, without further ado, here’s a run-down of the new features:
Usage:
[xml]
<SciChart:FastLineRenderableSeries ResamplingMode=”MinMaxWithUnevenSpacing”/>
[/xml]
Usage:
[xml]
<!– Note that ResamplingMode.Auto is the default setting –>
<SciChart:FastLineRenderableSeries ResamplingMode=”Auto”/>
[/xml]
Usage:
Multitouch is enabled by default in SciChart and all existing modifiers now have touch-support. To get a touch-specific pinch zoom action please use the PinchZoomModifier.
[xml]
<!– Adding the PinchZoomModifier gives SciChart the ability to zoom by pinching on a multi-touch screen –>
<sciChart:SciChartSurface.ChartModifier>
<sciChart:ModifierGroup>
<sciChart:PinchZoomModifier />
<sciChart:ZoomPanModifier />
<sciChart:ZoomExtentsModifier />
</sciChart:ModifierGroup>
</sciChart:SciChartSurface.ChartModifier>
[/xml]
Usage:
[xml]
<!– Styling Tick Labels with rotation and custom font-size and foreground –>
<s:DateTimeAxis>
<s:DateTimeAxis.TickLabelStyle>
<Style TargetType=”s:DefaultTickLabel”>
<Setter Property=”Foreground” Value=”Blue” />
<Setter Property=”FontSize” Value=”25″ />
<Setter Property=”LayoutTransform”>
<Setter.Value>
<RotateTransform Angle=”45″ />
</Setter.Value>
</Setter>
</Style>
</s:DateTimeAxis.TickLabelStyle>
</s:DateTimeAxis>
[/xml]
Or
[xml]
<!– Styling Numeric Axis Tick Labels –>
<s:NumericAxis>
<s:NumericAxis.TickLabelStyle>
<Style TargetType=”s:NumericTickLabel”>
<Setter Property=”Foreground” Value=”Blue” />
<Setter Property=”FontSize” Value=”25″ />
</Style>
</s:NumericAxis.TickLabelStyle>
</s:NumericAxis>
[/xml]
[xml]
<!– Declare an Axis Title Template –>
<Style x:Key=”BottomAxisTitleStyle” TargetType=”s:AxisTitle”>
<Setter Property=”ContentTemplate”>
<Setter.Value>
<DataTemplate>
<StackPanel>
<TextBlock Margin=”0,3,0,0″
Style=”{StaticResource TitleTextStyle}”
Text=”Showing time on”/>
<TextBlock HorizontalAlignment=”Center”
VerticalAlignment=”Center”
Text=”{Binding}” />
<TextBlock Margin=”0,0,0,3″
Style=”{StaticResource TitleTextStyle}”
Text=”(daily Timeframe)”/>
</StackPanel>
</DataTemplate>
</Setter.Value>
</Setter>
</Style>
<!– Apply an Axis Title Template –>
<s:DateTimeAxis AxisTitle=”Time Axis Title” TitleStyle=”{StaticResource BottomAxisTitleStyle}” Style=”{StaticResource AxisStyle}”/>
[/xml]
Usage:
[csharp]
// Tickprovider Declaration
public class CustomTickProvider : TickProvider
{
public override DateTime[] GetMinorTicks(IAxisParams axis)
{
return new DateTime[] { new DateTime(2014, 1, 5), new DateTime(2014, 1, 15), new DateTime(2014, 1, 25) };
}
public override DateTime[] GetMajorTicks(IAxisParams axis)
{
return new DateTime[] { new DateTime(2014, 1, 1), new DateTime(2014, 1, 10), new DateTime(2014, 1, 20) };
}
}
// Using a TickProvider in code
var axis = new DateTimeAxis();
axis.TickProvider = new CustomTickProvider();
[/csharp]
OR
[xml]
<!– Where CustomTickProvider is declared as a Resource –>
<sciChart:DateTimeAxis TickProvider=”{StaticResource CustomTickProvider}”/>
[/xml]
[xml]
<!– Create Y Axis with IsStaticAxis flag –>
<sciChart:SciChartSurface.YAxes>
<sciChart:NumericAxis IsStaticAxis=”True” />
</sciChart:SciChartSurface.YAxes>
[/xml]
Usage:
[xml]
<!– Bind X and Y Axis VisibleRangeLimit to ViewModel properties –>
<s:SciChartSurface.XAxis>
<s:NumericAxis VisibleRangeLimit=”{Binding XLimit}”/>
</s:SciChartSurface.XAxis>
<s:SciChartSurface.YAxis>
<s:NumericAxis VisibleRangeLimit=”{Binding YLimit}”/>
</s:SciChartSurface.YAxis>
[/xml]
[csharp]
// Viewmodel properties declared as
private DoubleRange _xLimit;
public DoubleRange XLimit
{
get { return _xLimit; }
set
{
if (_xLimit == value) return;
_xLimit = value;
OnPropertyChanged(“XLimit”);
}
}
private DoubleRange _yLimit;
public DoubleRange YLimit
{
get { return _yLimit; }
set
{
if (_yLimit == value) return;
_yLimit = value;
OnPropertyChanged(“YLimit”);
}
}
[/csharp]
Usage:
[xml]
<!– Create an X Axis –>
<s:SciChartSurface.XAxis>
<s:NumericAxis VisibleRangeChanged=”OnXAxisVisibleRangeChanged”/>
</s:SciChartSurface.XAxis>
[/xml]
[csharp]// …
private void OnXAxisVisibleRangeChanged(object sender, VisibleRangeChangedEventArgs e)
{
if (e.IsAnimating)
{
// Handle animation changes here
// Note the event will fire once more after animating with e.IsAnimating is false
// so tracking the state of this property can give you information to exclude
// animation Visibility changes e.g. if you are tracking zoom history
}
}
[/csharp]
Usage:
[csharp]
// Use this code to Serialize just annotations
private string SerializeAnnotations(AnnotationCollection annotationCollection)
{
var stream = new MemoryStream();
var serializer = new XmlSerializer(typeof (AnnotationCollection));
serializer.Serialize(stream, annotationCollection);
stream.Position = 0;
string xmlText = new StreamReader(stream).ReadToEnd();
return xmlText;
}
// Use this code to Deserialize just annotations
private AnnotationCollection DeserializeAnnotations(string xmlText)
{
var stream = new MemoryStream(Encoding.ASCII.GetBytes(xmlText));
var serializer = new XmlSerializer(typeof(AnnotationCollection));
stream.Position = 0;
var annotationCollection = (AnnotationCollection) serializer.Deserialize(stream);
return annotationCollection;
}
// Use this code to Serialize/Deserialize a SciChartSurface
private void SerializeChart()
{
var beforeChart = new SciChartSurface();
// …
var stream = new MemoryStream();
var serializer = new XmlSerializer(typeof(SciChartSurface));
serializer.Serialize(stream, beforeChart);
var afterChart = (SciChartSurface)serializer.Deserialize(stream);
}
[/csharp]
Usage:
[xml]
<SciChart:SciChartSurface MaxFrameRate=”24″>
[/xml]
Usage:
[csharp]var surface = new SciChartSurface();
//…
// Export to in-memory bitmap
var bitmapSource = surface.ExportToBitmapSource();
// Export directly to file
surface.ExportToFile(“Filename.png”,ExportType.Png);
[/csharp]
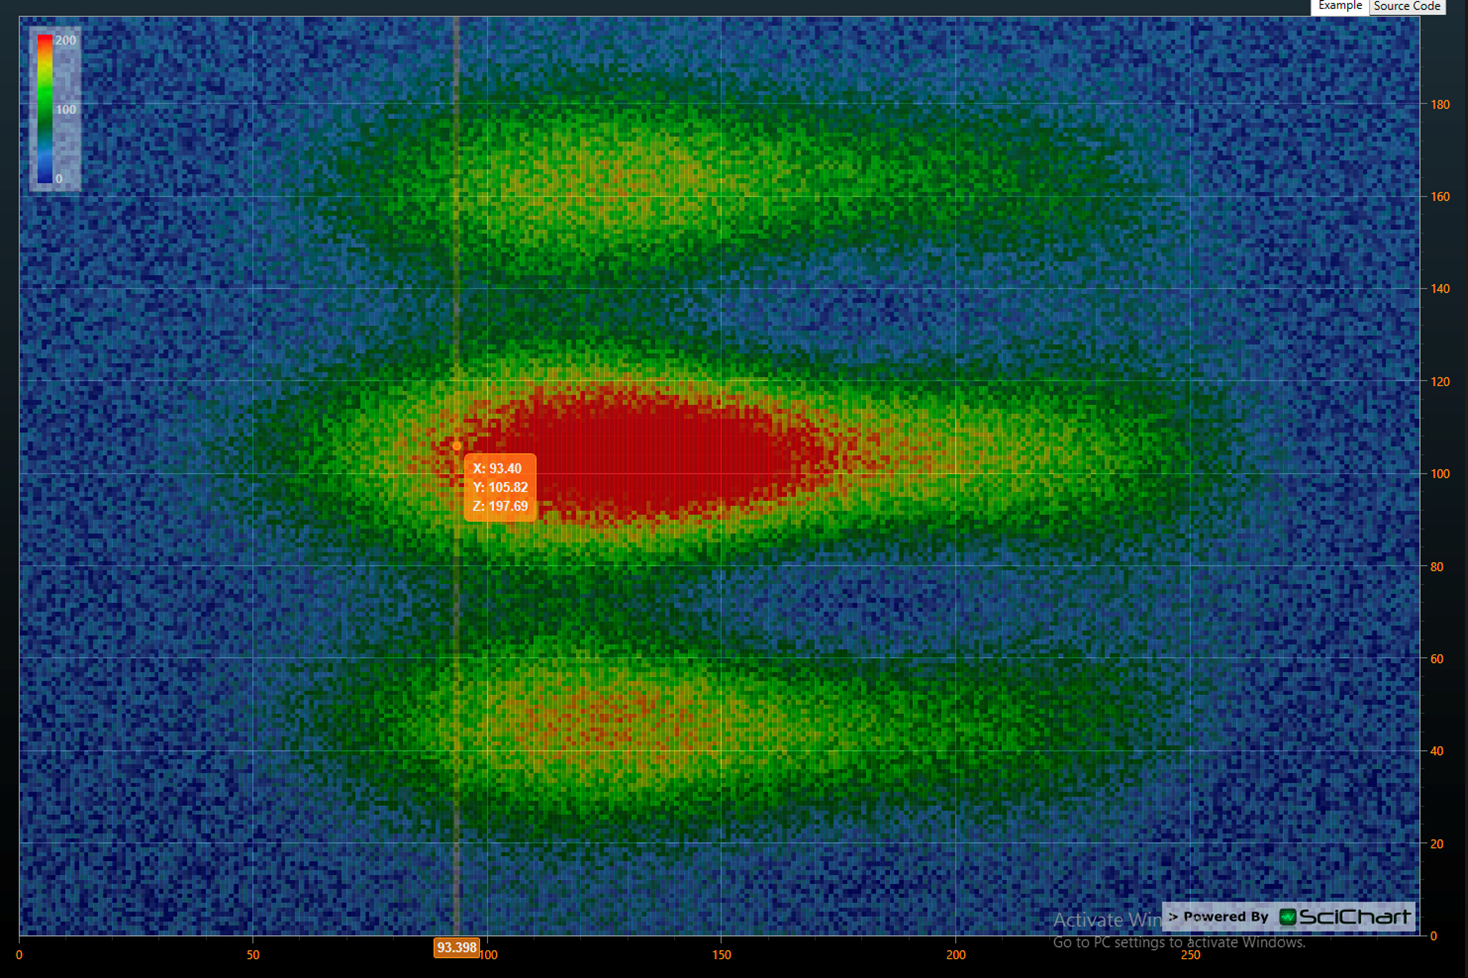
[xml]
<s:SciChartSurface.RenderableSeries>
<s:FastHeatMapRenderableSeries x:Name=”heatmapSeries”
Opacity=”0.5″
Maximum=”200″>
<!– Defining the Color Map using WPF LinearGradientBrush –>
<s:FastHeatMapRenderableSeries.ColorMap>
<LinearGradientBrush>
<GradientStop Offset=”0″ Color=”DarkBlue” />
<GradientStop Offset=”0.2″ Color=”CornflowerBlue” />
<GradientStop Offset=”0.4″ Color=”DarkGreen” />
<GradientStop Offset=”0.6″ Color=”Chartreuse” />
<GradientStop Offset=”0.8″ Color=”Yellow” />
<GradientStop Offset=”1″ Color=”Red” />
</LinearGradientBrush>
</s:FastHeatMapRenderableSeries.ColorMap>
<!– Defining the RolloverMarkerTemplate for use with Rollover –>
<s:FastHeatMapRenderableSeries.RolloverMarkerTemplate>
<ControlTemplate>
<s:TemplatableControl>
<s:TemplatableControl.ContentTemplate>
<DataTemplate>
<Ellipse Width=”9″
Height=”9″
Fill=”Red”
Stroke=”Blue”
StrokeThickness=”2″ />
</DataTemplate>
</s:TemplatableControl.ContentTemplate>
</s:TemplatableControl>
</ControlTemplate>
</s:FastHeatMapRenderableSeries.RolloverMarkerTemplate>
</s:FastHeatMapRenderableSeries>
</s:SciChartSurface.RenderableSeries>
<!– Defining the Heatmap Legend –>
<s:HeatmapColourMap Margin=”30″ HorizontalAlignment=”Left” VerticalAlignment=”Top”
FastHeatMapRenderableSeries=”{Binding ElementName=heatmapSeries, Mode=OneWay}”
Opacity=”0.5″
Orientation=”Vertical” />
[/xml]
[csharp]
/// <summary>
/// Returns a value that determines the position of Y zero line on a chart.
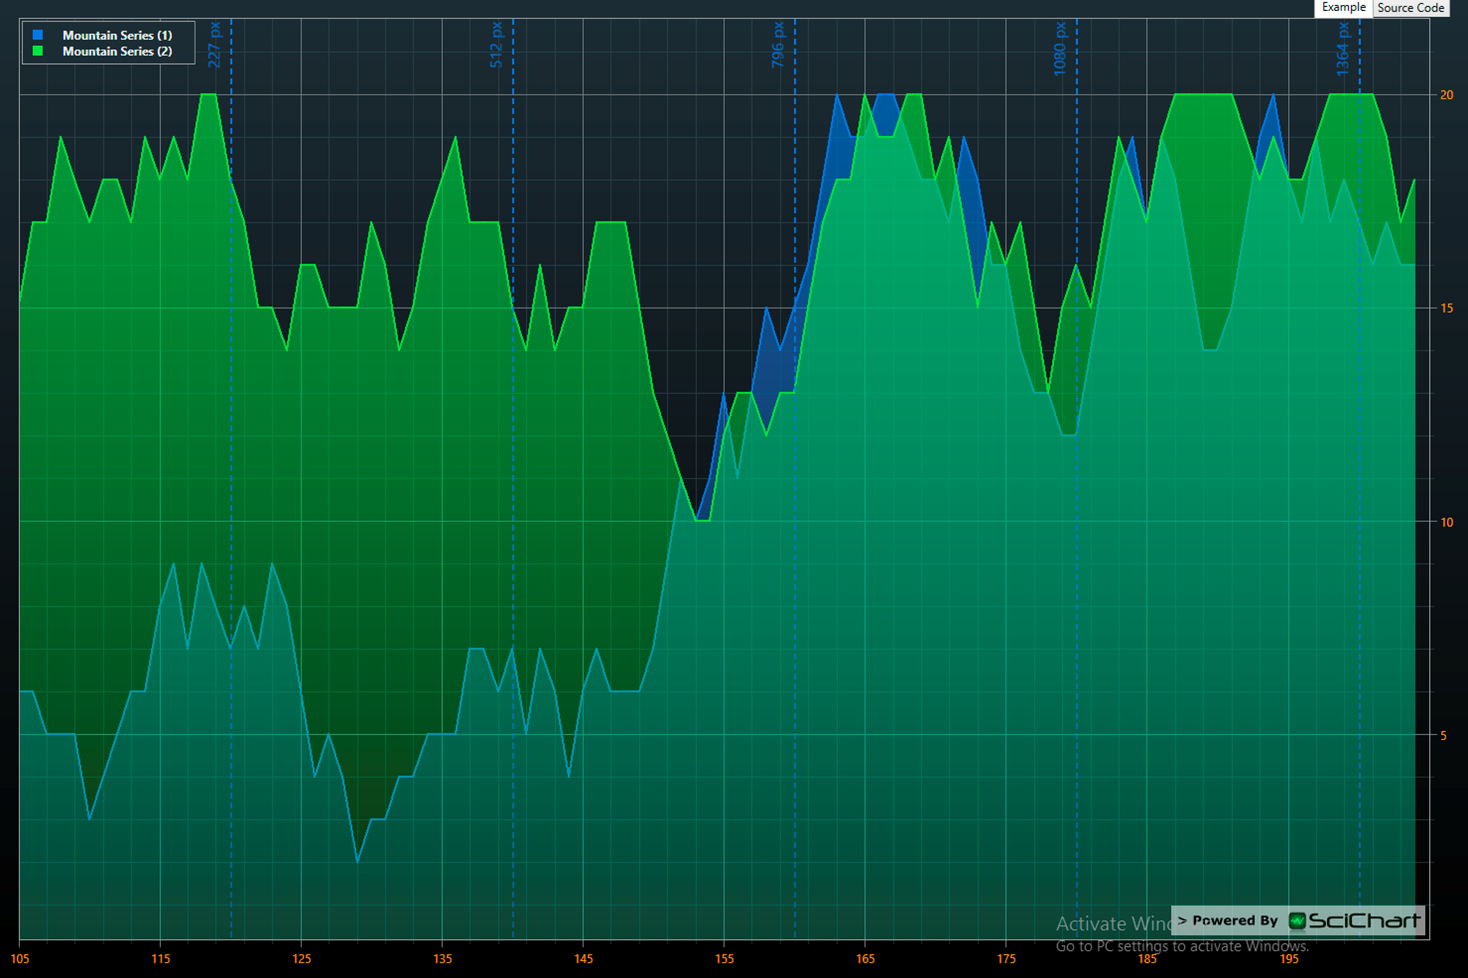
/// Significant for the series types that render negative data points differently,
/// such as the <see cref=”FastColumnRenderableSeries”/>, <see cref=”FastMountainRenderableSeries”/>, <see cref=”FastImpulseRenderableSeries”/>.
/// </summary>
/// <returns>The value in pixels indicating the position of zero line</returns>
protected virtual double GetYZeroCoord(){…}
[/csharp]
[csharp]
/// <summary>
/// An interface to a subset of methods on the SciChartSurface.
/// </summary>
public interface ISciChartController : ISuspendable, IInvalidatableElement
{
/// <summary>
/// Zooms the chart to the extents of the data, plus any X or Y Grow By fraction set on the X and Y Axes
/// </summary>
void ZoomExtents();
/// <summary>
/// Zooms to extents with the specified animation duration
/// </summary>
/// <param name=”duration”>The duration of animation when zooming to extents</param>
void AnimateZoomExtents(TimeSpan duration);
/// <summary>
/// Zooms the chart to the extents of the data in the Y-Direction, accounting for the current data in view in the X-direction
/// </summary>
void ZoomExtentsY();
/// <summary>
/// Zooms the chart to the extents of the data in the Y-Direction, accounting for the current data in view in the X-direction
/// </summary>
void AnimateZoomExtentsY(TimeSpan duration);
/// <summary>
/// Zooms the chart to the extents of the data in the X-Direction
/// </summary>
void ZoomExtentsX();
/// <summary>
/// Zooms the chart to the extents of the data in the X-Direction
/// </summary>
void AnimateZoomExtentsX(TimeSpan duration);
}
[/csharp]
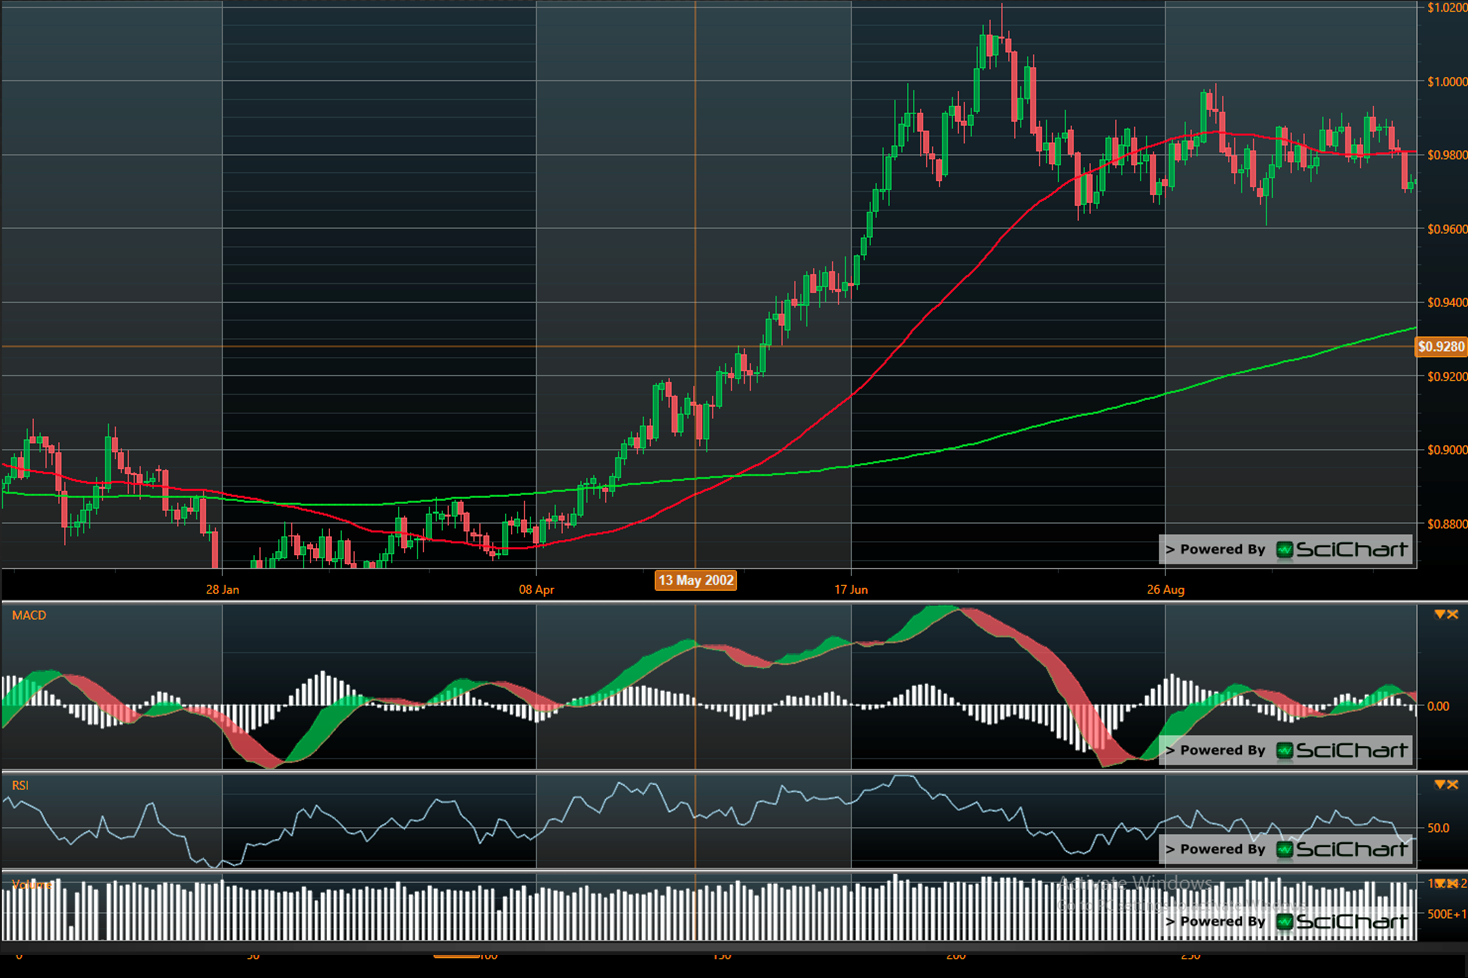
Usage:
[xml]
<!– Create the SciStockChart. In the code-behind we append data and add series –>
<s:SciStockChart Grid.Row=”1″ x:Name=”stockChart” s:ThemeManager.Theme=”BlackSteel”>
<!– Override any property of the built-in CategoryDateTimeAxis here –>
<s:SciStockChart.XAxisStyle>
<Style TargetType=”s:CategoryDateTimeAxis”>
<Setter Property=”DrawMinorGridLines” Value=”True”/>
<Setter Property=”DrawMajorGridLines” Value=”True”/>
<Setter Property=”DrawMajorBands” Value=”True”/>
<Setter Property=”MinorsPerMajor” Value=”5″/>
<Setter Property=”TextFormatting” Value=”dd MMM yyyy”/>
<Setter Property=”GrowBy” Value=”0, 0.1″/>
</Style>
</s:SciStockChart.XAxisStyle>
<!– Override any property of the built-in NumericAxis here –>
<s:SciStockChart.YAxisStyle>
<Style TargetType=”s:NumericAxis”>
<Setter Property=”DrawMinorGridLines” Value=”True”/>
<Setter Property=”DrawMajorGridLines” Value=”True”/>
<Setter Property=”DrawMajorBands” Value=”False”/>
<Setter Property=”MinorsPerMajor” Value=”5″/>
<Setter Property=”TextFormatting” Value=”0.0000″/>
</Style>
</s:SciStockChart.YAxisStyle>
<s:SciStockChart.RenderableSeries>
<s:FastCandlestickRenderableSeries AntiAliasing=”False”/>
</s:SciStockChart.RenderableSeries>
</s:SciStockChart>
[/xml]
[xml]
<!– Databinds a SciChartGroup to a list of ChartPaneViewModels –>
<!– Child chart panes are generated using the ItemTemplate below –>
<s:SciChartGroup Grid.Row=”1″
ItemsSource=”{Binding ChartPaneViewModels}”
s:ThemeManager.Theme=”{Binding ElementName=ThemeCombo, Path=SelectedItem}”
ItemContainerStyle=”{StaticResource ChartPaneStyle}”>
<s:SciChartGroup.ItemTemplate>
<DataTemplate>
<!– Databinds each child SciStockChart to … –>
<!– SeriesSource to BaseChartPaneViewModel.ChartSeriesViewModels –>
<!– Axis Properties, like s:StockChartXAxis.VisibleRange to CreateMultiPaneStockChartsViewModel.XVisibleRange –>
<!– Axis Properties, like s:StockChartYAxis.GrowBy to BaseChartPaneViewModel.IsFirstChartPane with a converter to change behaviour based on pane position–>
<s:SciStockChart Padding=”0″
BorderThickness=”0,0,1,1″
IsXAxisVisible=”{Binding IsFirstChartPane}”
IsPanEnabled=”{Binding ParentViewModel.IsPanEnabled}”
IsRubberBandZoomEnabled=”{Binding ParentViewModel.IsZoomEnabled}”
VerticalChartGroupId=”{Binding ParentViewModel.VerticalChartGroupId}”
SeriesSource=”{Binding ChartSeriesViewModels}”>
<!– … –>
</s:SciStockChart>
</DataTemplate>
</s:SciChartGroup.ItemTemplate>
</s:SciChartGroup>
[/xml]
With great power comes great responsibility! Every release of SciChart has more features, more bugs fixed, and therefore more potential to be slower than the last. In SciChart v3.0 we have made slight but important improvements to performance by:
We aim to keep working on this area and like a race car, shave off the extra milliseconds wherever we find them!
Several API changes have been made. Please follow these upgrade instructions if you experience one of the following compilation or runtime errors:
The following code will no longer compile:
[xml]
<s:FastHeatMapRenderableSeries x:Name=”heatmapSeries”
MaxColor=”#FF22AA”
MiddleColor=”CornflowerBlue”
MinColor=”DarkBlue”
Opacity=”0.5″
ScaleFactor=”0.005″ />
[/xml]
MaxColor, MiddleColor, MinColor, ScaleFactor have been replaced with the ColorMap feature described above.
The GetZeroCoord method has been renamed GetYZeroCoord. It is possible to override it in derived classes now.
ILabelFormatter has been renamed ILabelProvider. The property in AxisBase and all derived types have been renamed correspondingly. ILabelProvider has two new methods on it. If you are using custom LabelProviders in your code you will need to implement these methods, or, you will need to derive from LabelProviderBase, which provides default implementations below.
[csharp]
/// <summary>
/// Creates a <see cref=”ITickLabelViewModel”/> instance, based on the data-value passed in.
/// Invokes <see cref=”FormatLabel”/> to format the specified data-value passed in.
/// </summary>
/// <param name=”dataValue”>The data-value to format</param>
public virtual ITickLabelViewModel CreateDataContext(IComparable dataValue)
{
return UpdateDataContext(new DefaultTickLabelViewModel(), dataValue);
}
/// <summary>
/// Updates existing <see cref=”ITickLabelViewModel”/>, based on the data-value passed in.
/// Invokes <see cref=”FormatLabel”/> to format the specified data-value passed in.
/// </summary>
/// <param name=”labelDataContext”>The instance to update</param>
/// <param name=”dataValue”>The data-value to format</param>
public virtual ITickLabelViewModel UpdateDataContext(ITickLabelViewModel labelDataContext, IComparable dataValue)
{
var formatted = FormatLabel(dataValue);
labelDataContext.Text = formatted;
return labelDataContext;
}
[/csharp]
In order to allow tracking VisibleRange changes in some advanced scenarios (e.g. updating a Slider which controls chart zoom level), the VisibleRangeChanged event is fired for the changes induced by animation now. To keep the previous behaviour, the IsAnimating property has been added to the VisibleRangeChangedEventArgs. Hence you will need to do things as follows to prevent getting notified about animation changes:
[csharp]
private void OnXAxisVisibleRangeChanged(object sender, VisibleRangeChangedEventArgs e)
{
// This check prevents from receiving notifications during animation
if (!e.IsAnimating)
{
// Handle other VisibleRange changes here
}
}
[/csharp]
If you receive a compilation error on using UnsortedXyDataSeries, simply replace it for XyDataSeries. It should now ‘just work’.
Please note, we’ve made the following changes to how we document and support SciChart. These are part of an on-going strategy to streamline support and effectively provide you information. Changes include:
SciChart v3.0 ships with a 30-day trial key embedded in the application. If you’re an existing customer of SciChart with an active support subscription, you will automatically qualify for an upgrade to SciChart v3.0 and your license key should just work.
If your support has expired and you would like to renew your support subscription, please contact sales@scichart.com and we will be glad to assist.
Simply head over to www.scichart.com/downloads and get the latest installer package. We recommend the MSI package as this contains the examples suite as well as the SciChart libraries
Related Posts
![]()
Queens Award for Innovation
Proud winners of the Queens Award for Innovation, 2019. Awarded on account of our innovative graphics engine which underpins the SciChart library and enables our world-beating charting performance
![]()
National Business Awards
Highly Commended for Lloyds National Business Awards, 2019. Awarded on account of our innovative graphics engine and impressive customer base
![]()
National Technology Awards
Awarded “Healthcare Tech of the Year” at the 2025 National Technology Awards – a top UK recognition for breakthrough innovation in technology.

Reviews
SciChart has received hundreds of verified, 3rd party reviews