SciChart.js v5.1.0 Released!
Just six weeks after the release of SciChart.js v5.0, we have another minor update for you: SciChart.js v5.1.0. In this […]
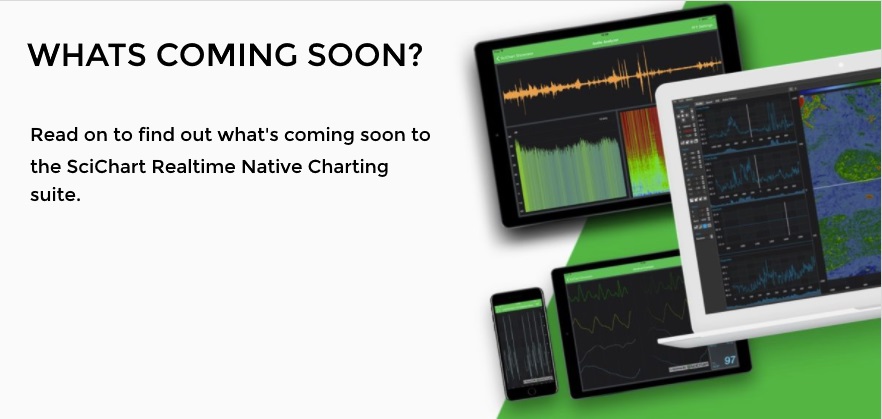
We’ve been quiet for a while, so we thought it was a good time to make an announcement about what we have been working on, and what we are doing soon for SciChart in Q3 & Q4 2017.
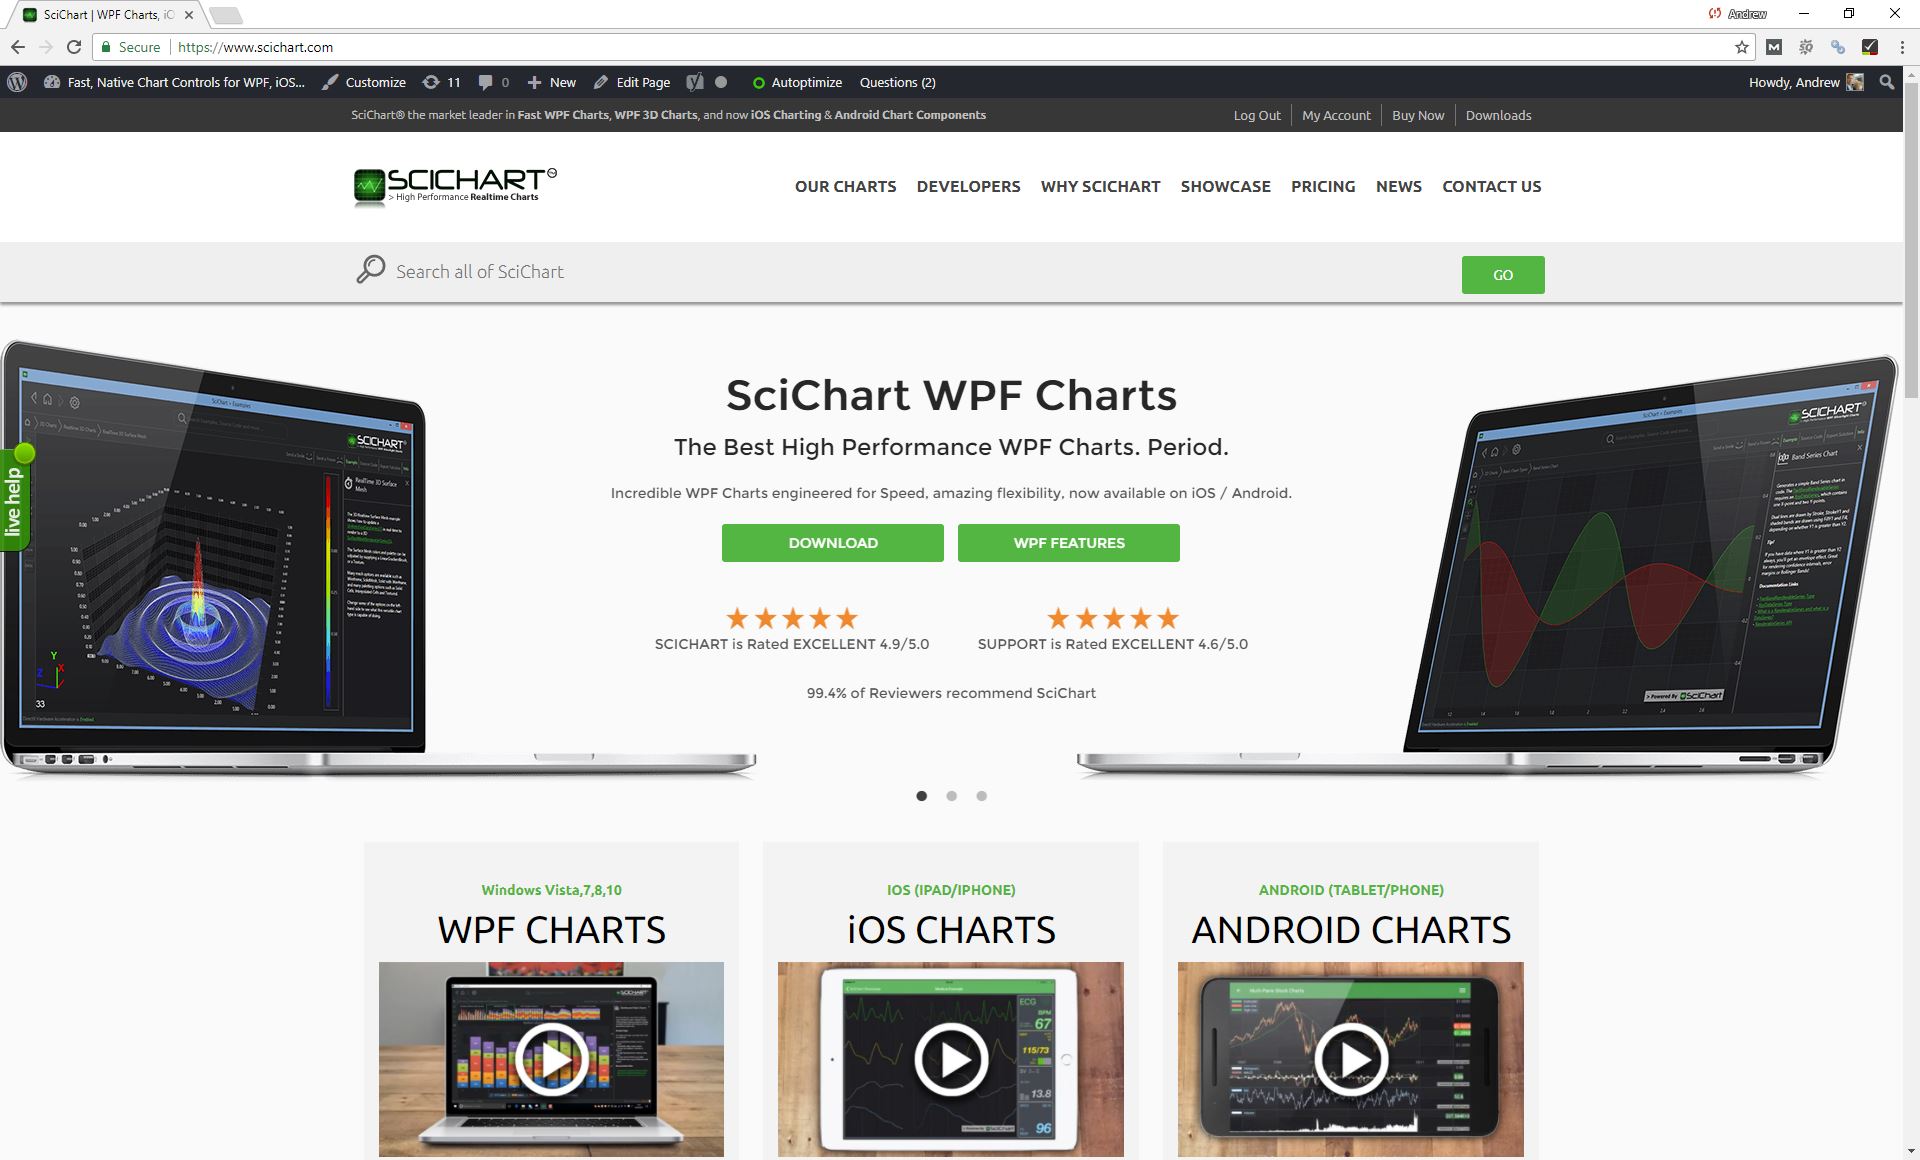
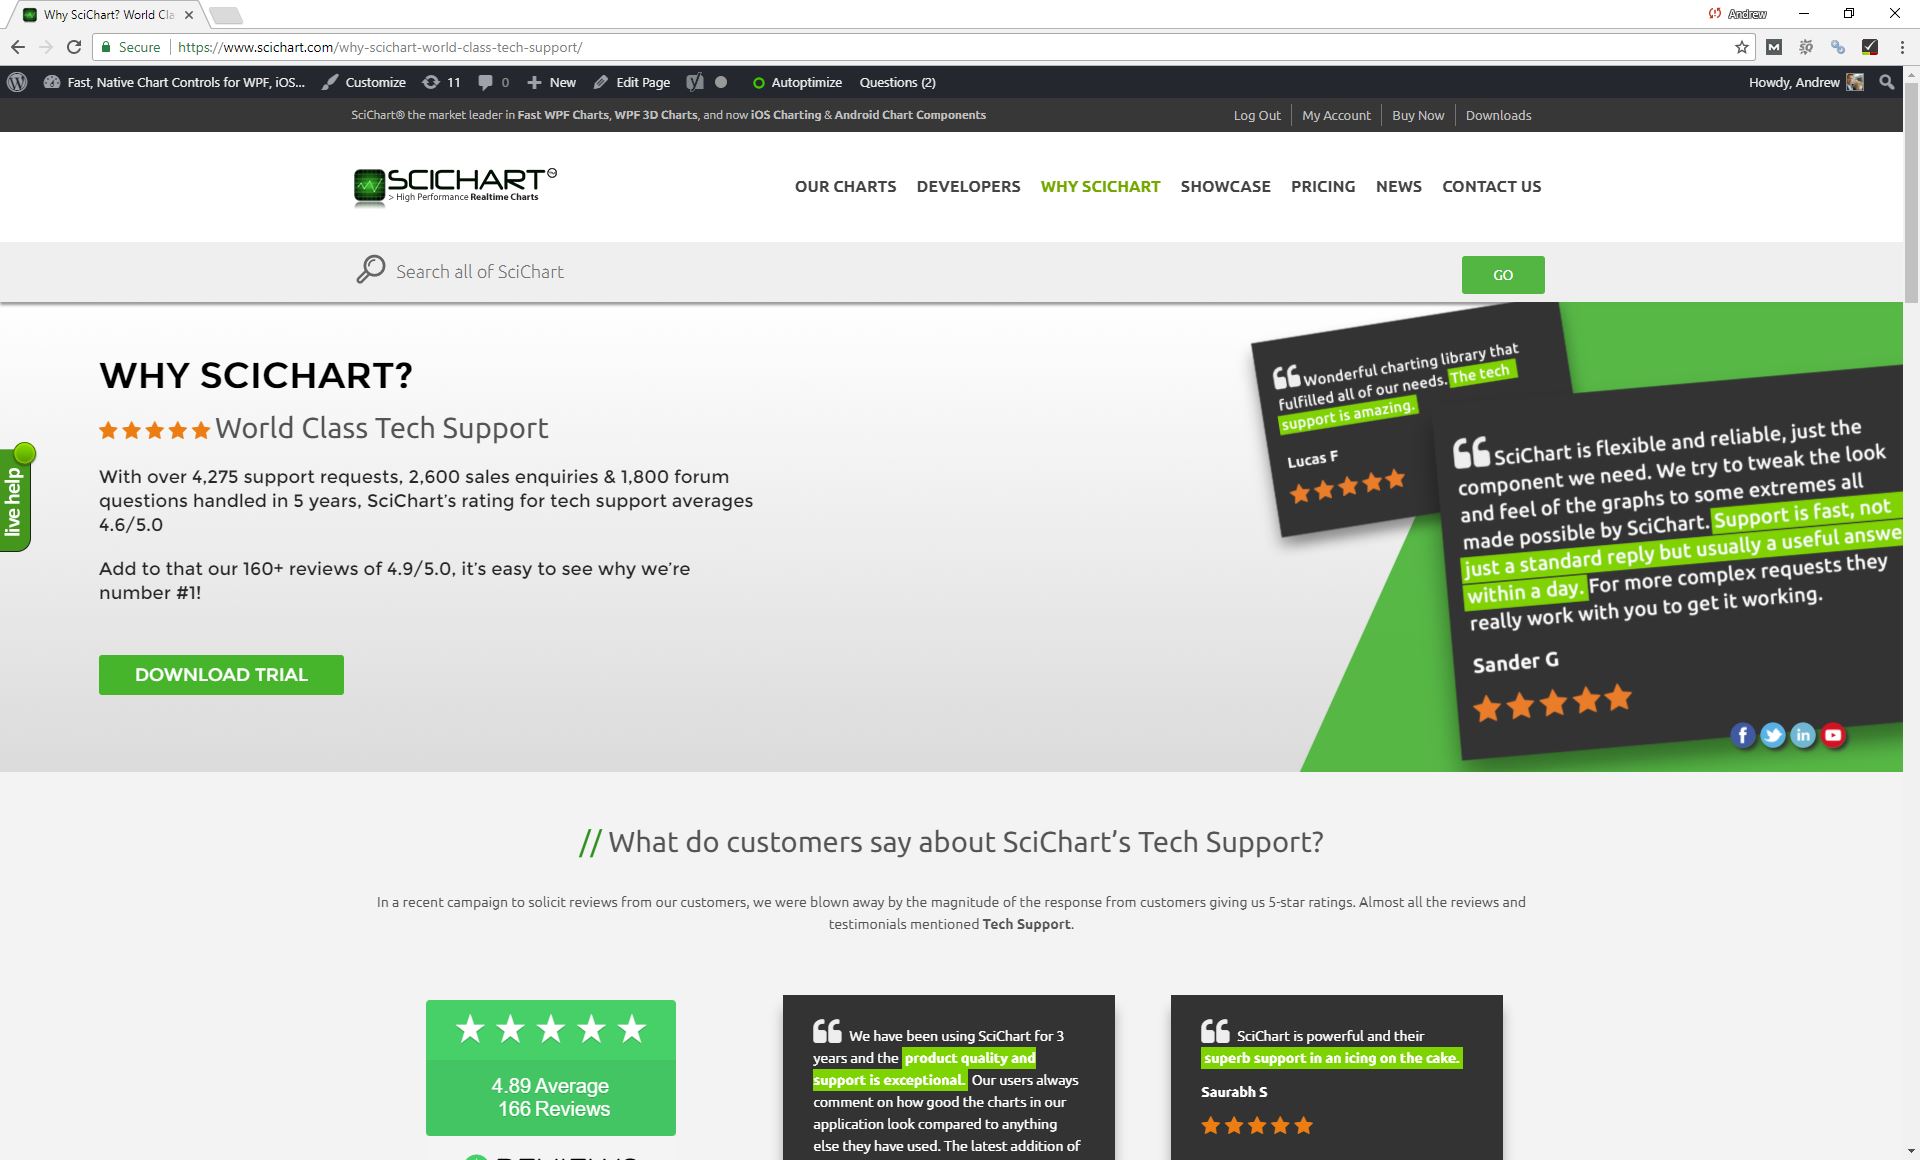
Over the summer, the SciChart website has undergone a revamp! We’ve included a lot more information to help prospective customers with the right information to help them choose SciChart as a charting component. This includes the new styled menu, as well as Why SciChart and Showcase pages. Have a look if you haven’t already! We hope you like what you see!

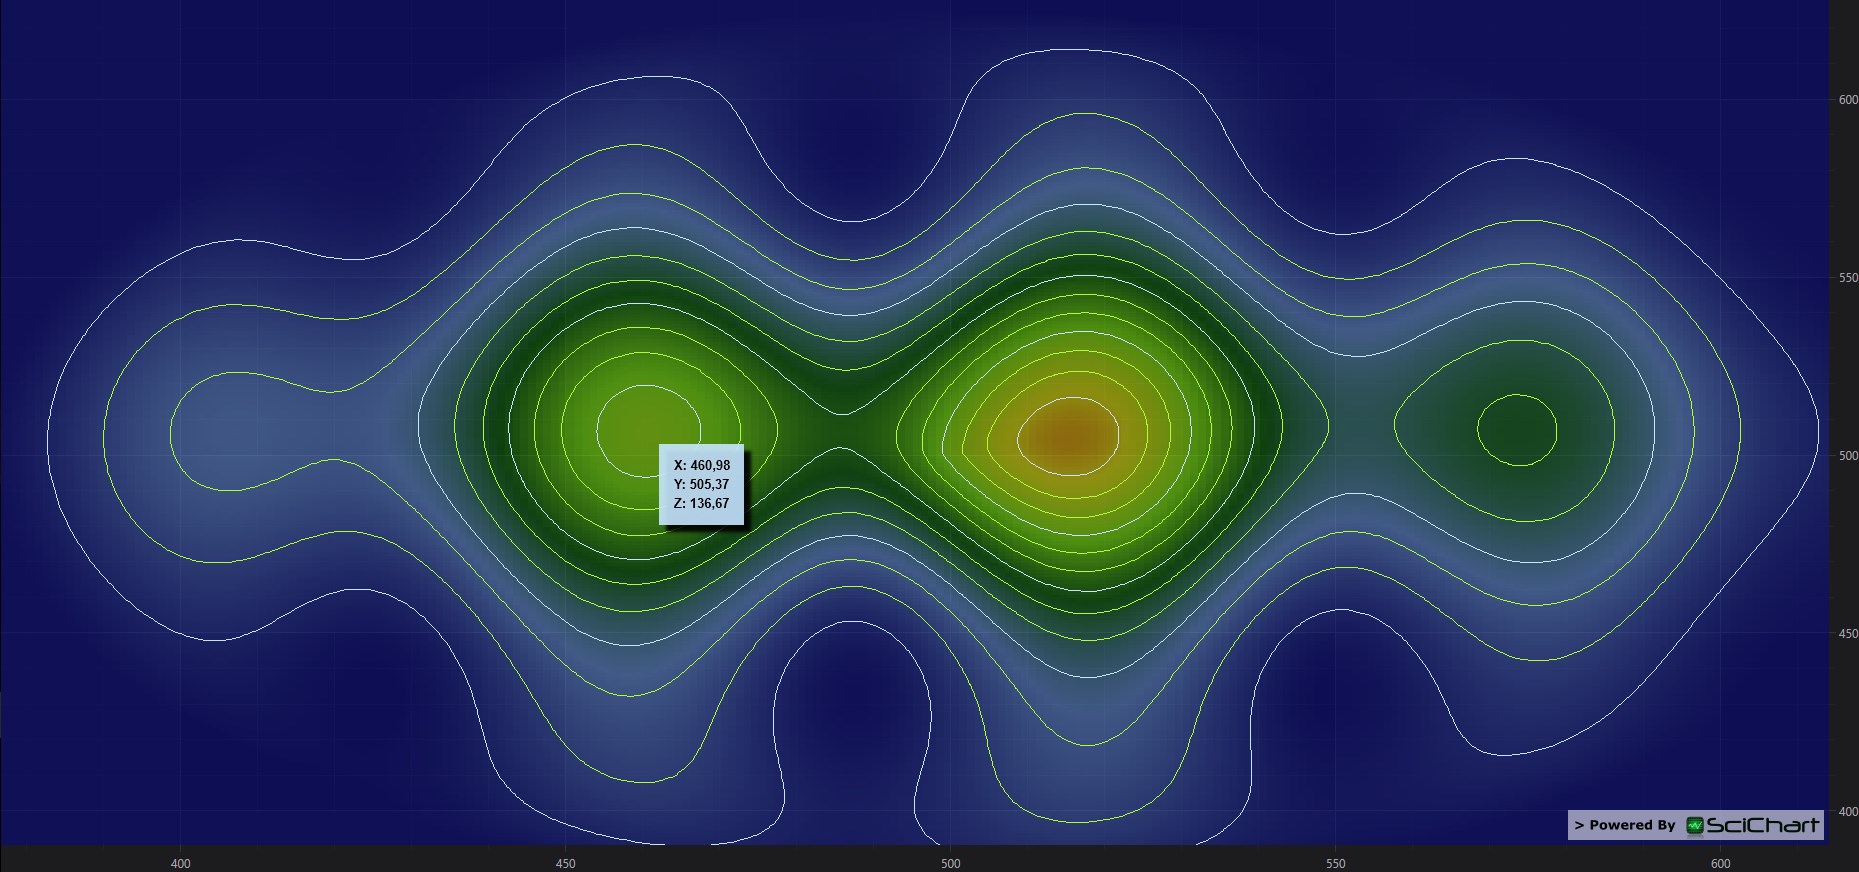
Our flagship product: SciChart WPF, is undergoing a major revision. This is a huge release which incorporates a lot of feature requests, bug fixes and improvements which you have requested. SciChart WPF v5 is in BETA now and will include:
Yuriy on our team has managed to create a prototype for SciChart on UWP. Can you believe it! This has been hard work due to the maturity of the UWP API. We have faced problems such as lack of MarkupExtension, no support for Bindings in styles, no dependency property inheritance, no RelativeSource FindAncestor binding etc… However, through hard work and sheer determination he has managed to get a chart rendering with several of our series types in Universal Windows Platform. We hope to be releasing a BETA for this shortly along with the release of SciChart WPF v5.
After the release of SciChart iOS/Android v2.1 we aim to be focussing on our getting-started guides, documentation and more as per your feedback from our features survey.
We would welcome your continued feedback on what you would like added to the iOS & Android charts.
What else are we working on? As well as projects for the immediate future, this is our roadmap for the rest of 2017 and beyond.
We’re continually trying to improve our SciChart iOS & Android documentation to make it easy to use and get started, and maintain the great reputation we have from SciChart WPF into our new products.
If you would like to feed back on what documentation topics you want added to SciChart iOS & Android, please contact us.
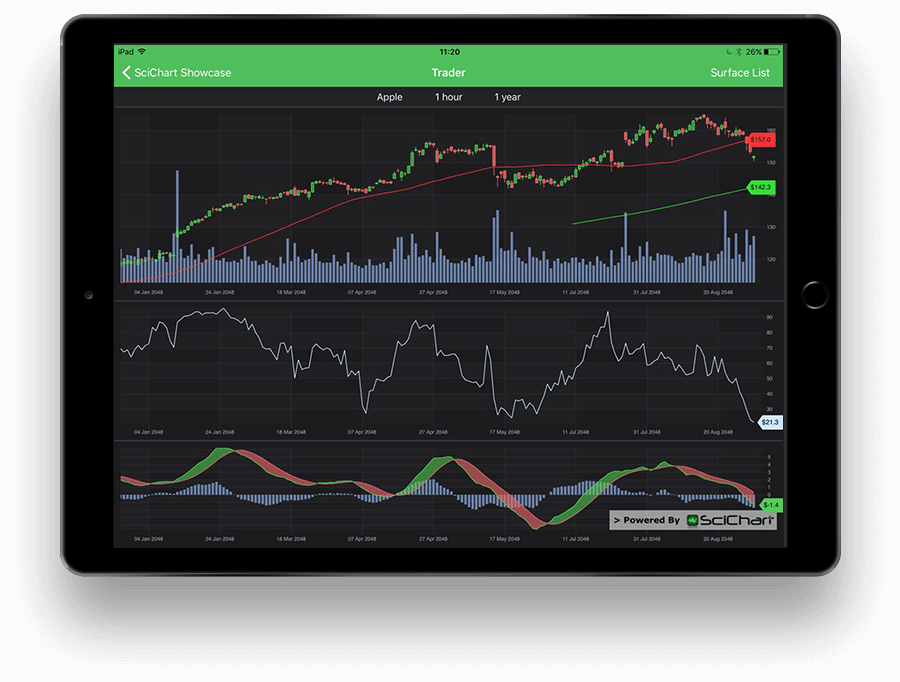
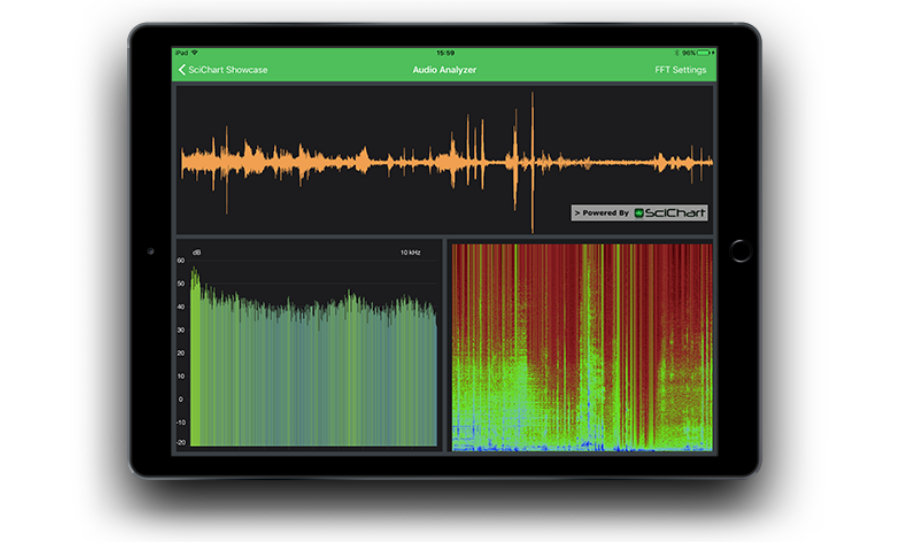
We are also planning to publish the SciChart iOS/Android Examples to the AppStore as well as the SciChart iOS/Android Showcase. The showcase features some great demos, including the Spectrum Analyzer demo, the ECG demo and now a new Trading App demo. These are available currently from our Github repositories: https://github.com/abtsoftware/SciChart.iOS.Examples and https://github.com/abtsoftware/SciChart.Android.Examples

It is very early days but we are working to include our 3D engine into SciChart iOS/Android to allow 3D Charts on these platforms. We hope to release this in 2018.
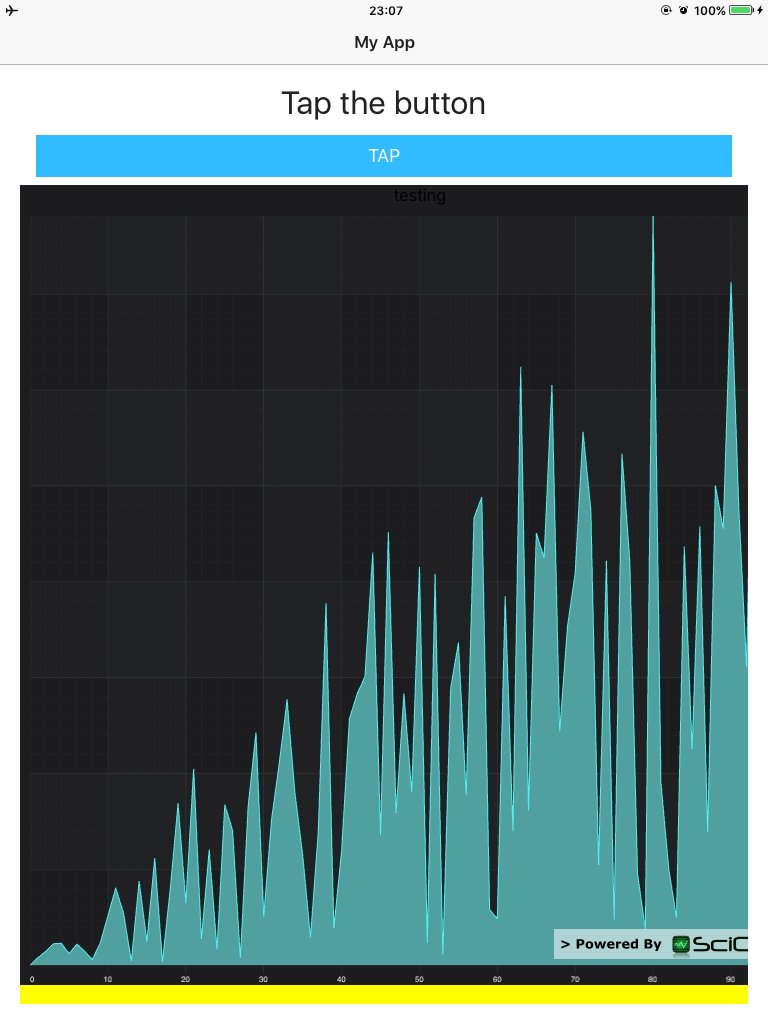
Super popular ReactNative and NativeScript frameworks allow javascript or TypeScript software development on the iOS & Android platforms, but with near native performance. We are working on prototypes to demonstrate how to include our super-fast native iOS & Android charts.
We already have a very early prototype for using SciChart with NativeScript on our Github repository: https://github.com/ABTSoftware/SciChart.NativeScript.examples/tree/NewCharts. This shows a simple line chart (nothing more) and shows you how to use SciChart iOS + Android with this popular framework. More to follow!
Is there anything else you would like us to add to SciChart, SciChart’s documentation or examples or our website? Please contact us!
Best regards,
Andrew
[SciChart Team]
Related Posts
![]()
Queens Award for Innovation
Proud winners of the Queens Award for Innovation, 2019. Awarded on account of our innovative graphics engine which underpins the SciChart library and enables our world-beating charting performance
![]()
National Business Awards
Highly Commended for Lloyds National Business Awards, 2019. Awarded on account of our innovative graphics engine and impressive customer base
![]()
National Technology Awards
Awarded “Healthcare Tech of the Year” at the 2025 National Technology Awards – a top UK recognition for breakthrough innovation in technology.

Reviews
SciChart has received hundreds of verified, 3rd party reviews