DirectX Compatibility in WPF Charts with SciChart
SciChart now features an optional DirectX10 based renderer. This is currently included as an add-on to the SciChart High Performance […]
// Update: The SciChart v4 SDK with WPF 3D Charts has now been released!
Please see our WPF 3D Chart Features page and Pricing Page for more details. For any enquiries, please contact us!
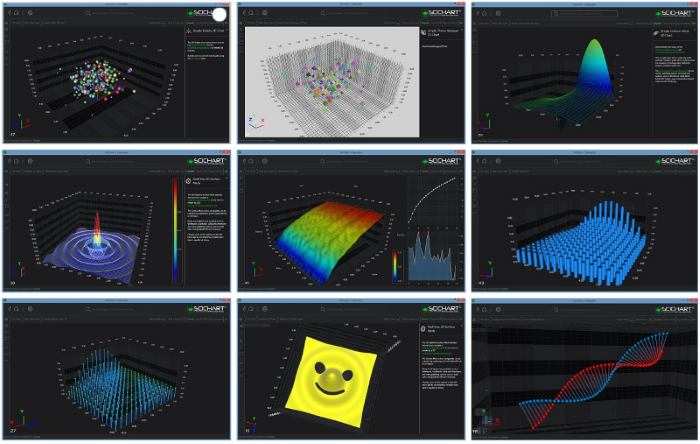
You may have noticed that SciChart 3D WPF Charts are coming soon! Along with version 4 of our legendary best-in-class WPF Charts. We wanted to post a few more screenshots and features info about this powerful new WPF 3D Chart control, which is coming very soon.
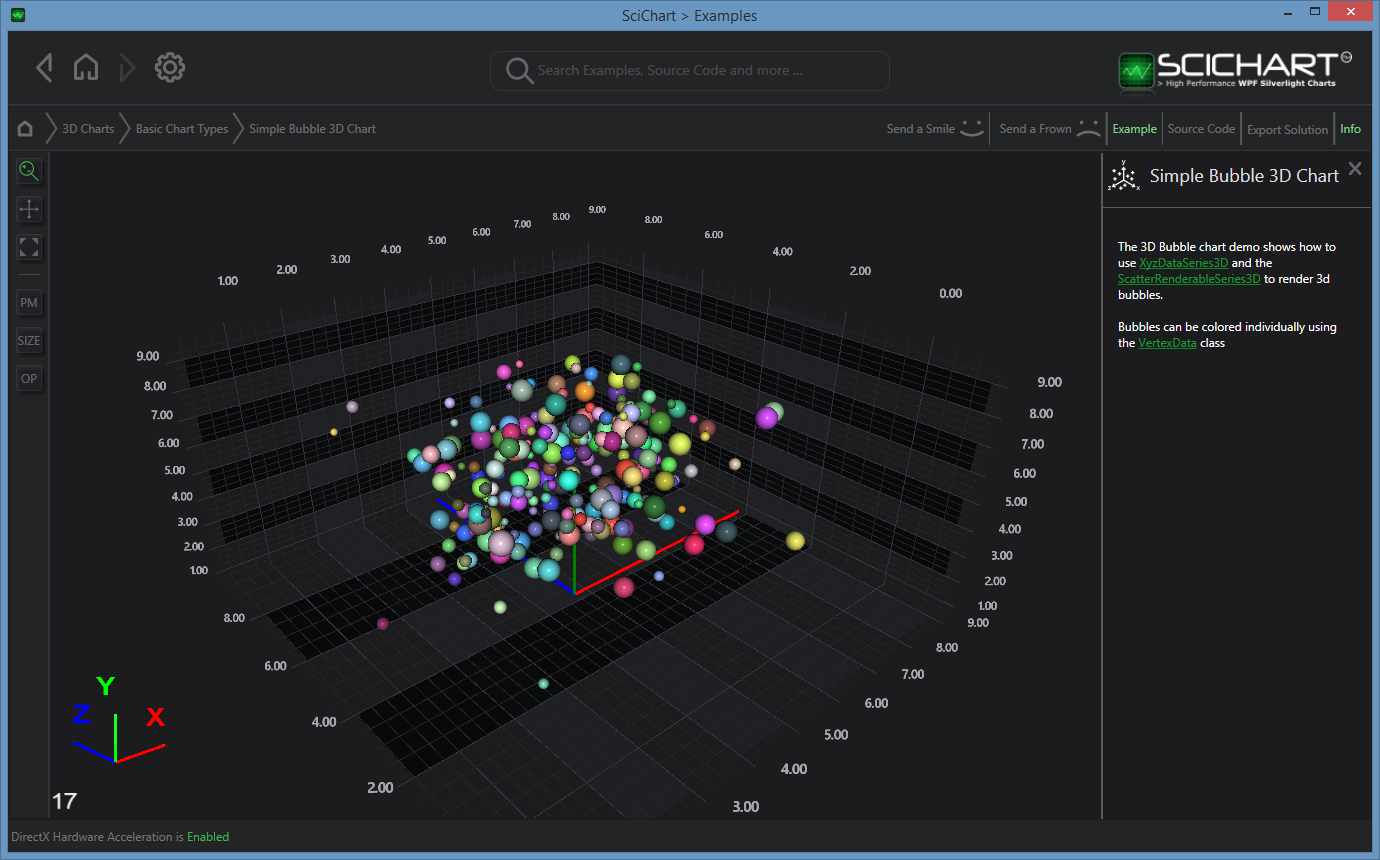
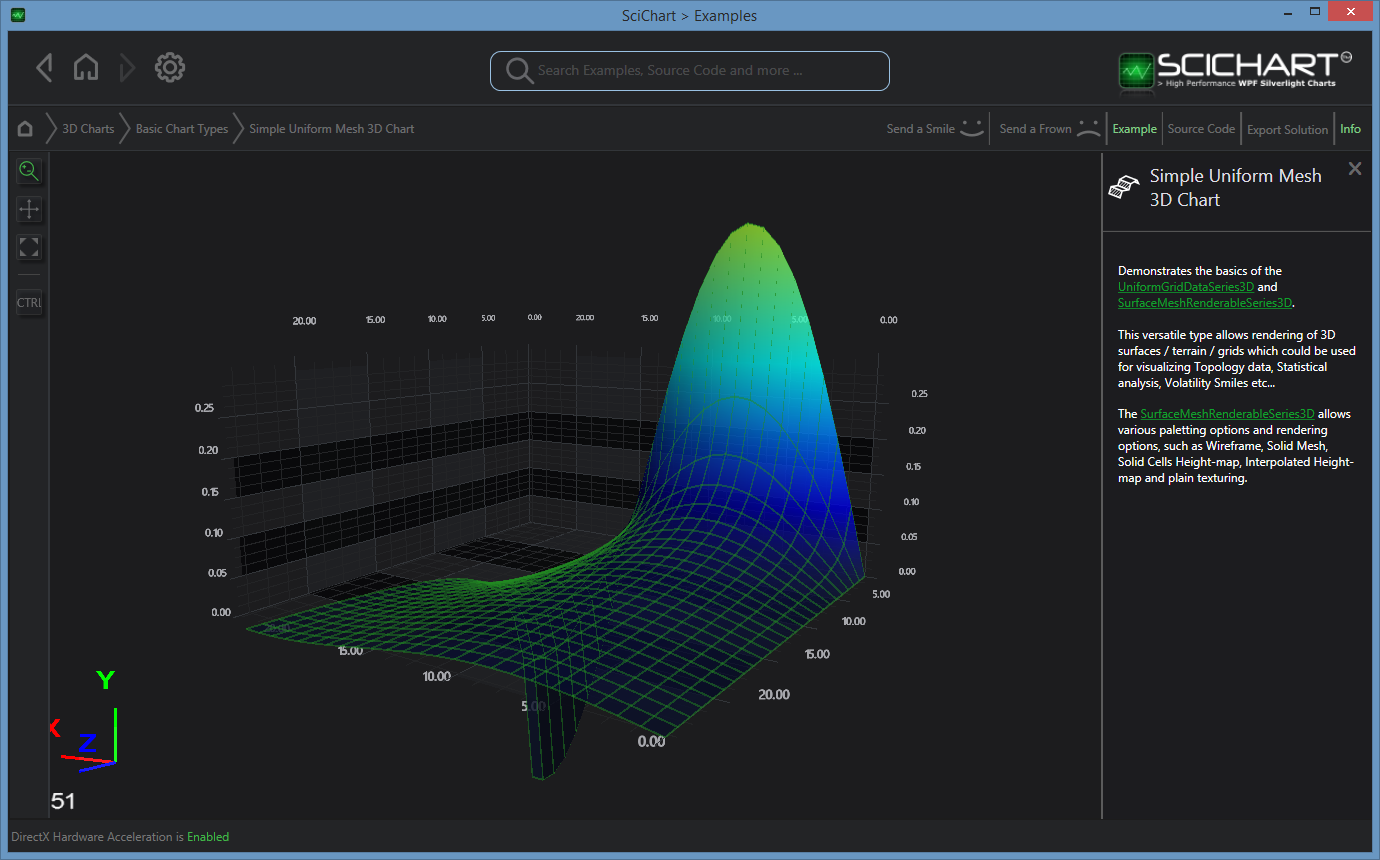
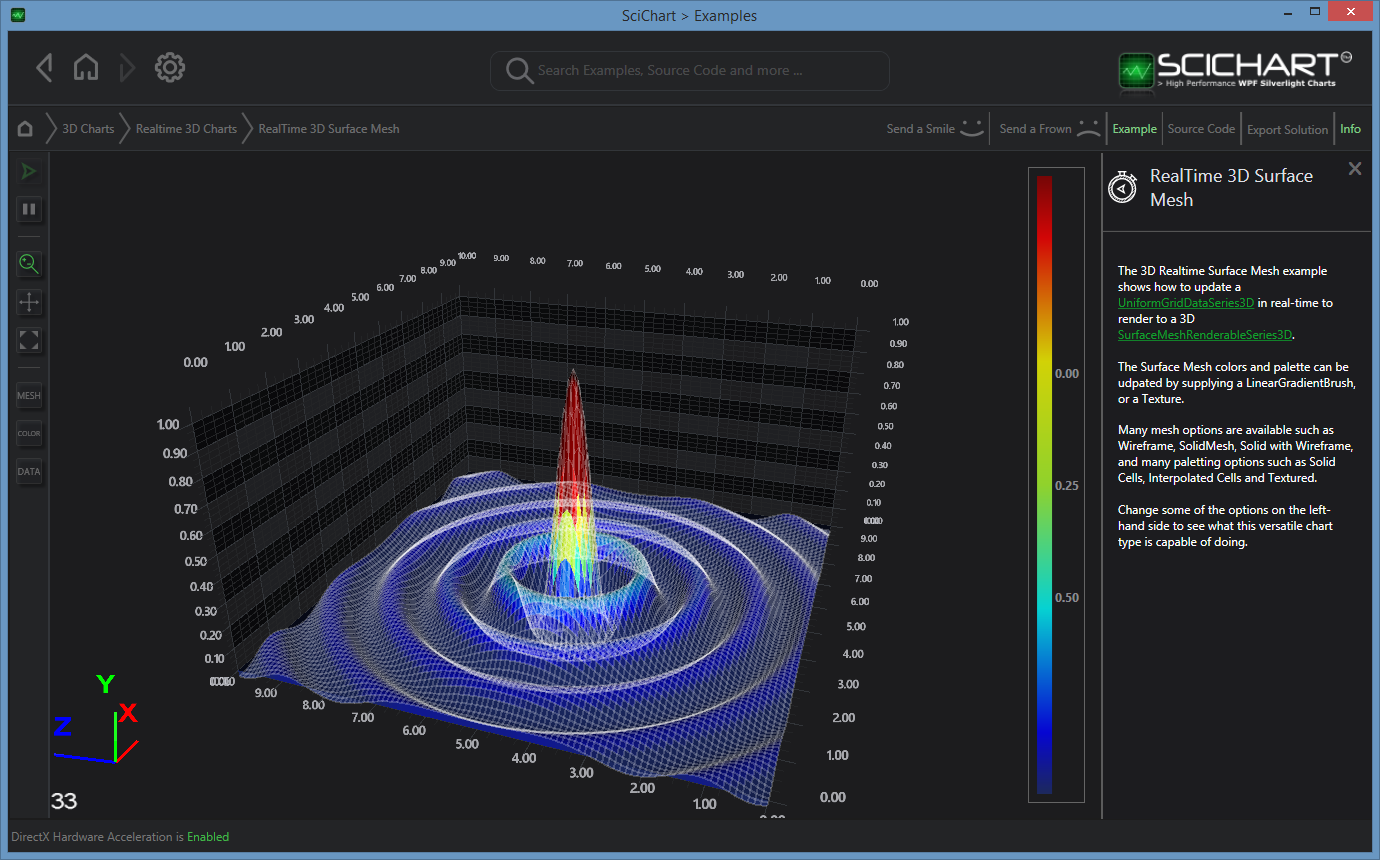
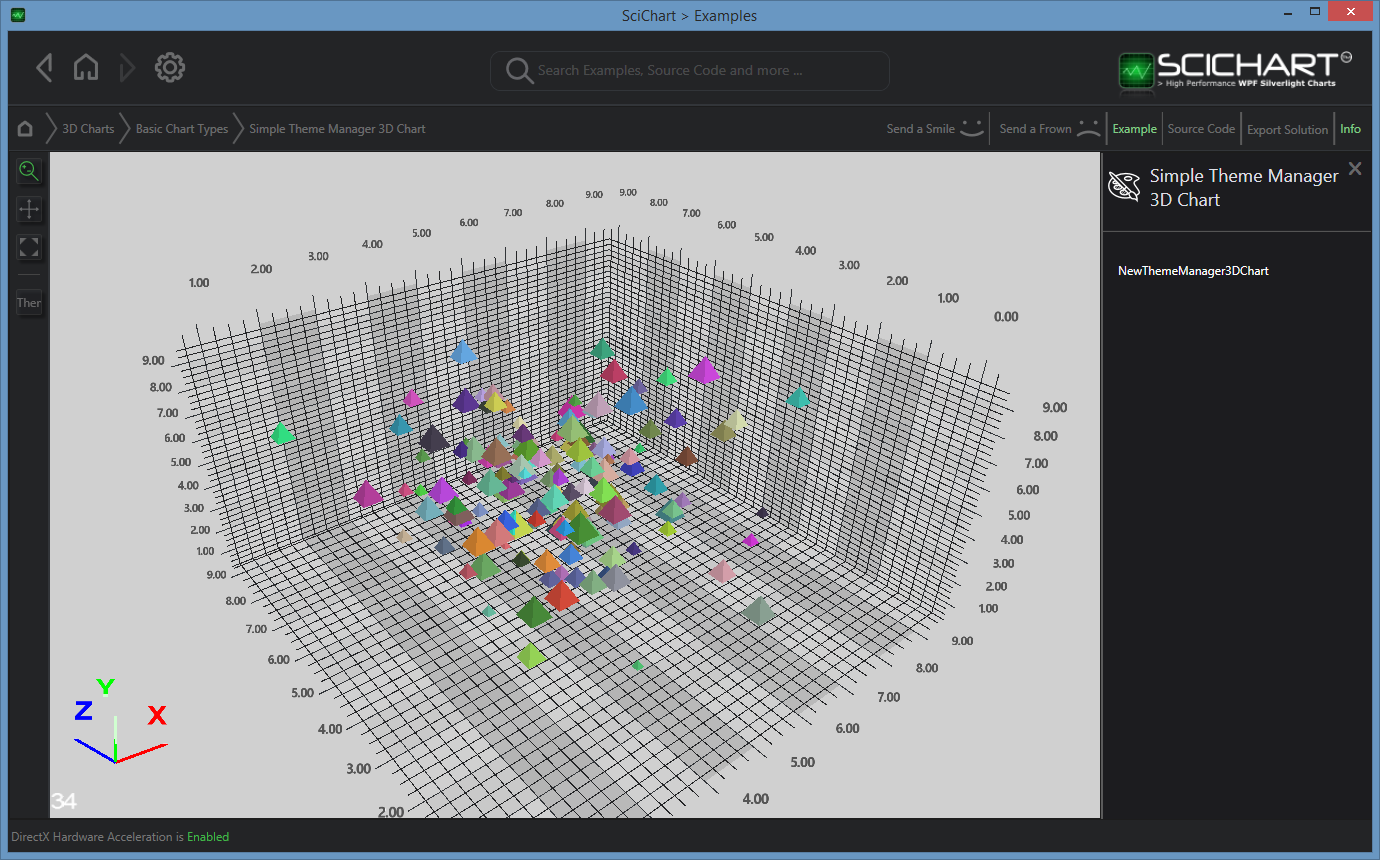
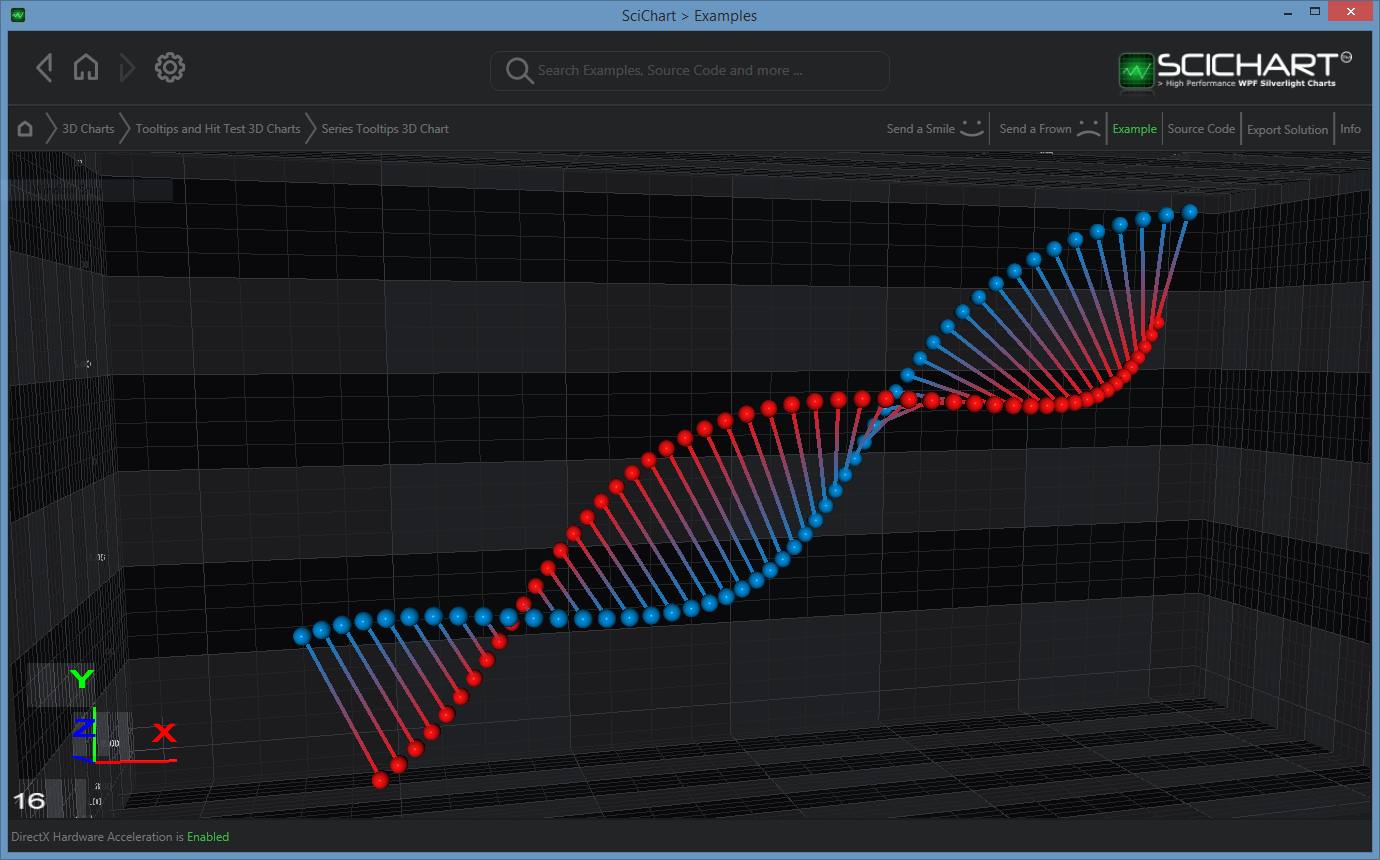
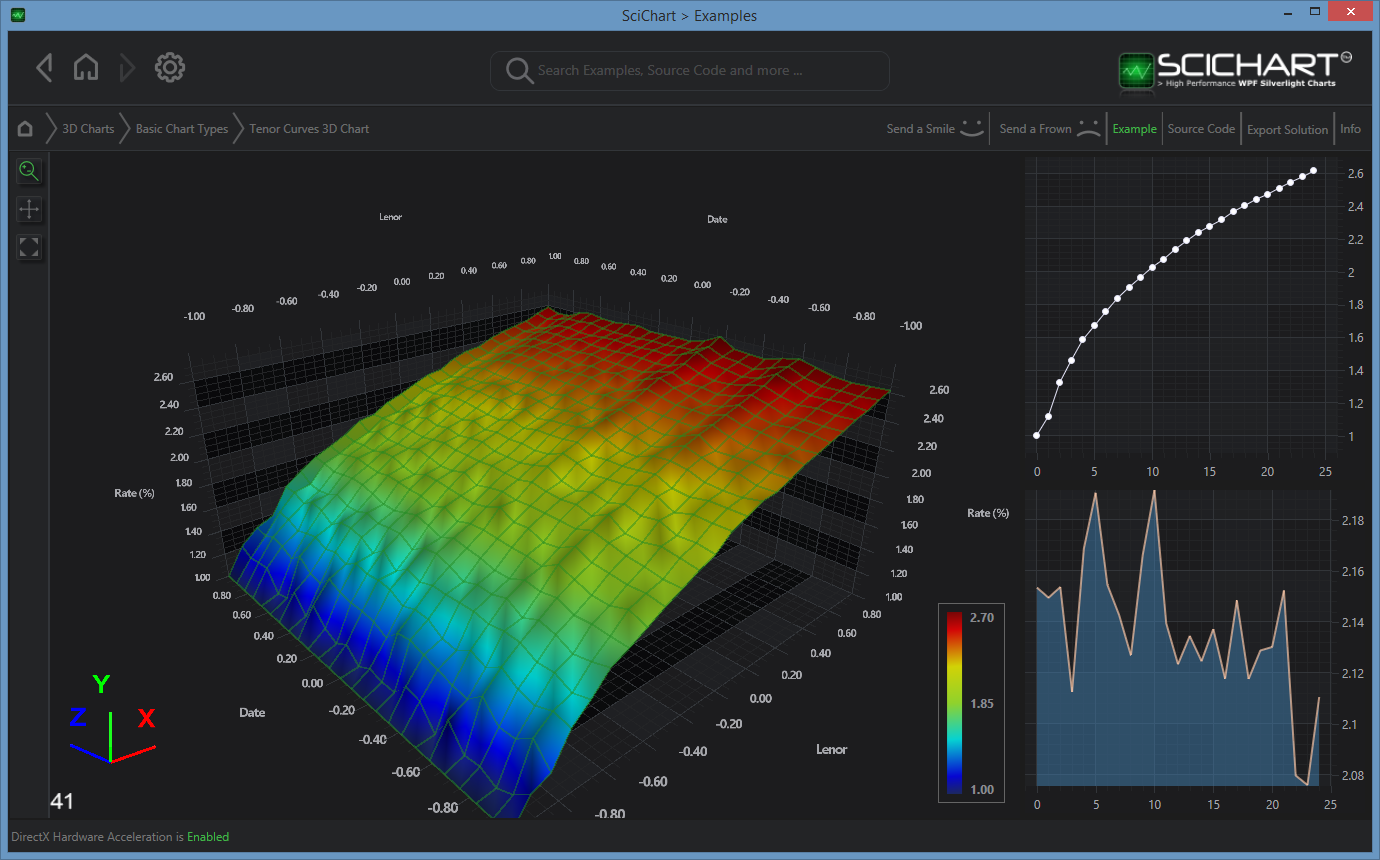
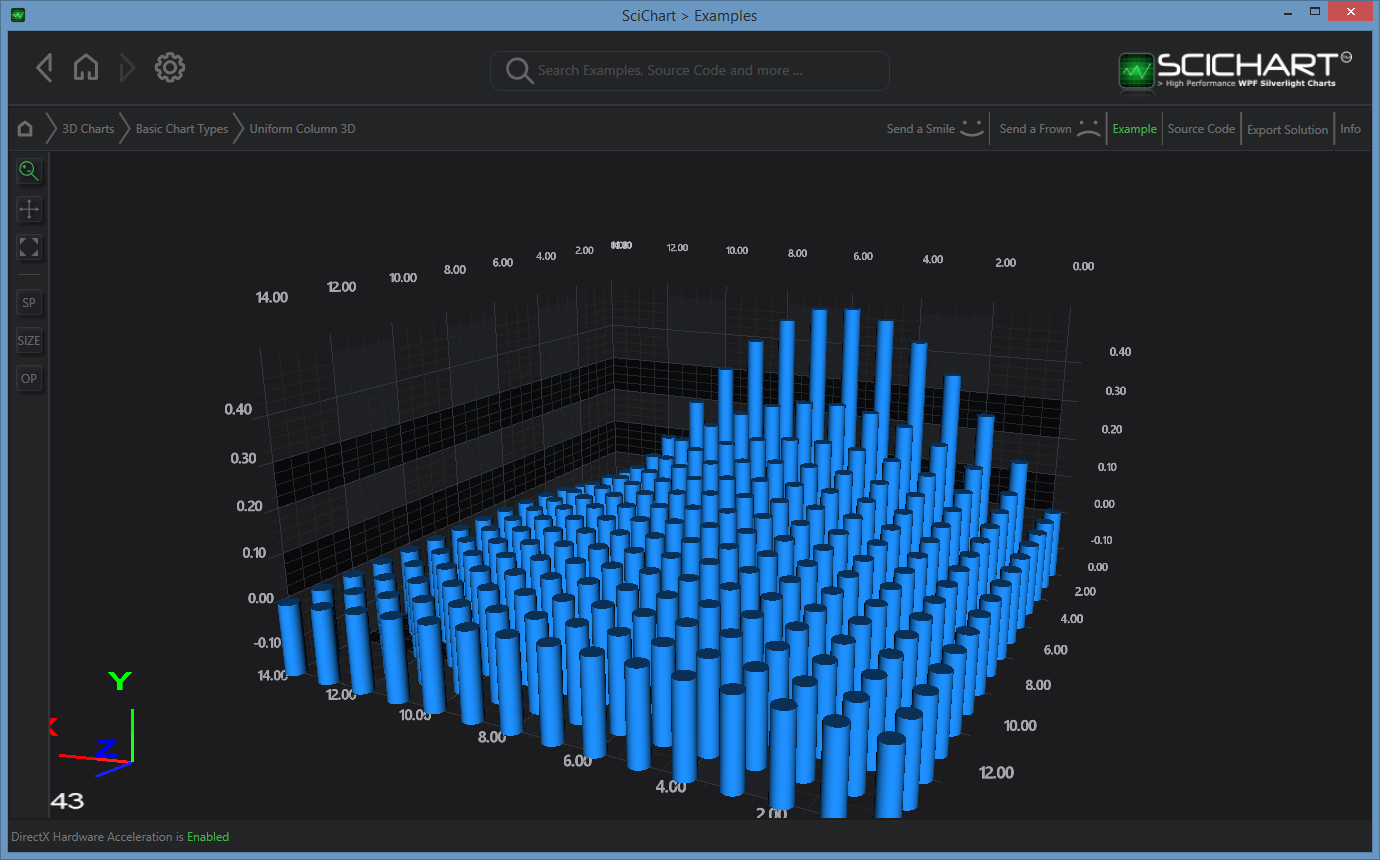
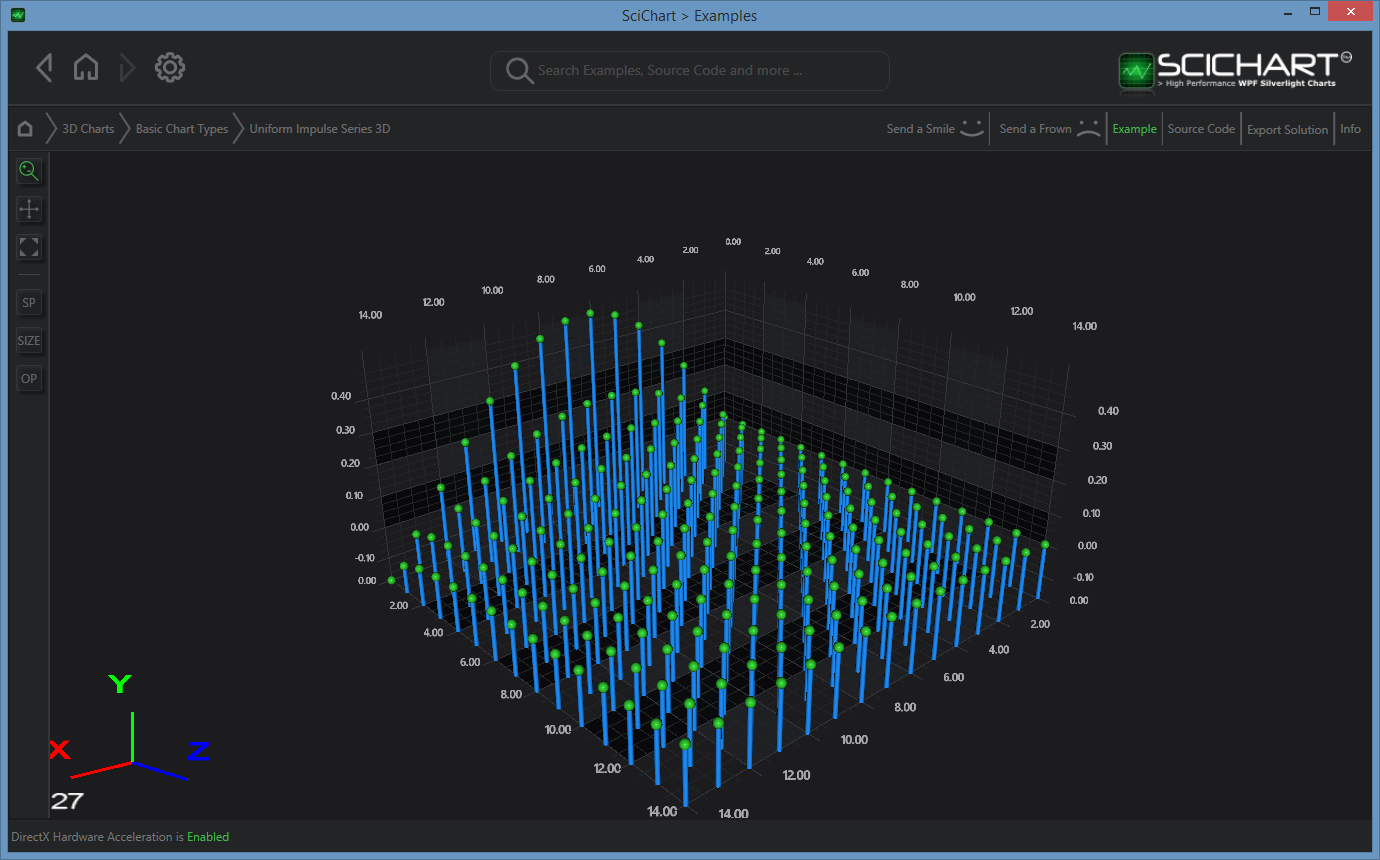

Features are still in flux, but the first release is likely to include:
Pricing & Licensing is to be announced soon, but we will be providing an early bird discount for new purchases of SciChart 3D WPF Charts and a slightly steeper early-bird discount for existing customers of SciChart WPF 2D.
So keep watching our releases page as the early-bird discount won’t last long!
Best regards,
[SciChart Team]
Related Posts
![]()
Queens Award for Innovation
Proud winners of the Queens Award for Innovation, 2019. Awarded on account of our innovative graphics engine which underpins the SciChart library and enables our world-beating charting performance
![]()
National Business Awards
Highly Commended for Lloyds National Business Awards, 2019. Awarded on account of our innovative graphics engine and impressive customer base
![]()
National Technology Awards
Awarded “Healthcare Tech of the Year” at the 2025 National Technology Awards – a top UK recognition for breakthrough innovation in technology.

Reviews
SciChart has received hundreds of verified, 3rd party reviews