Pre loader

SciChart 2021 – What you might have missed & What’s Coming Soon in 2022

Categories

SciChart 2021 – What you might have missed & What’s Coming Soon in 2022

In many ways 2021 has been an incredible year of growth for SciChart, and I wanted to share with you some of our progress in 2021 to ensure you didn’t miss anything, what’s available to you as a customer of SciChart and what is coming soon in 2022. 

Many customers are delighted with our software, and we consistently receive a 5* rating on external review sites. With this year’s improvements we will help you create innovative, cutting-edge charting applications with incredible performance, features and stability, helping you win business & outpace your competitors. 

Releases and Updates in 2021

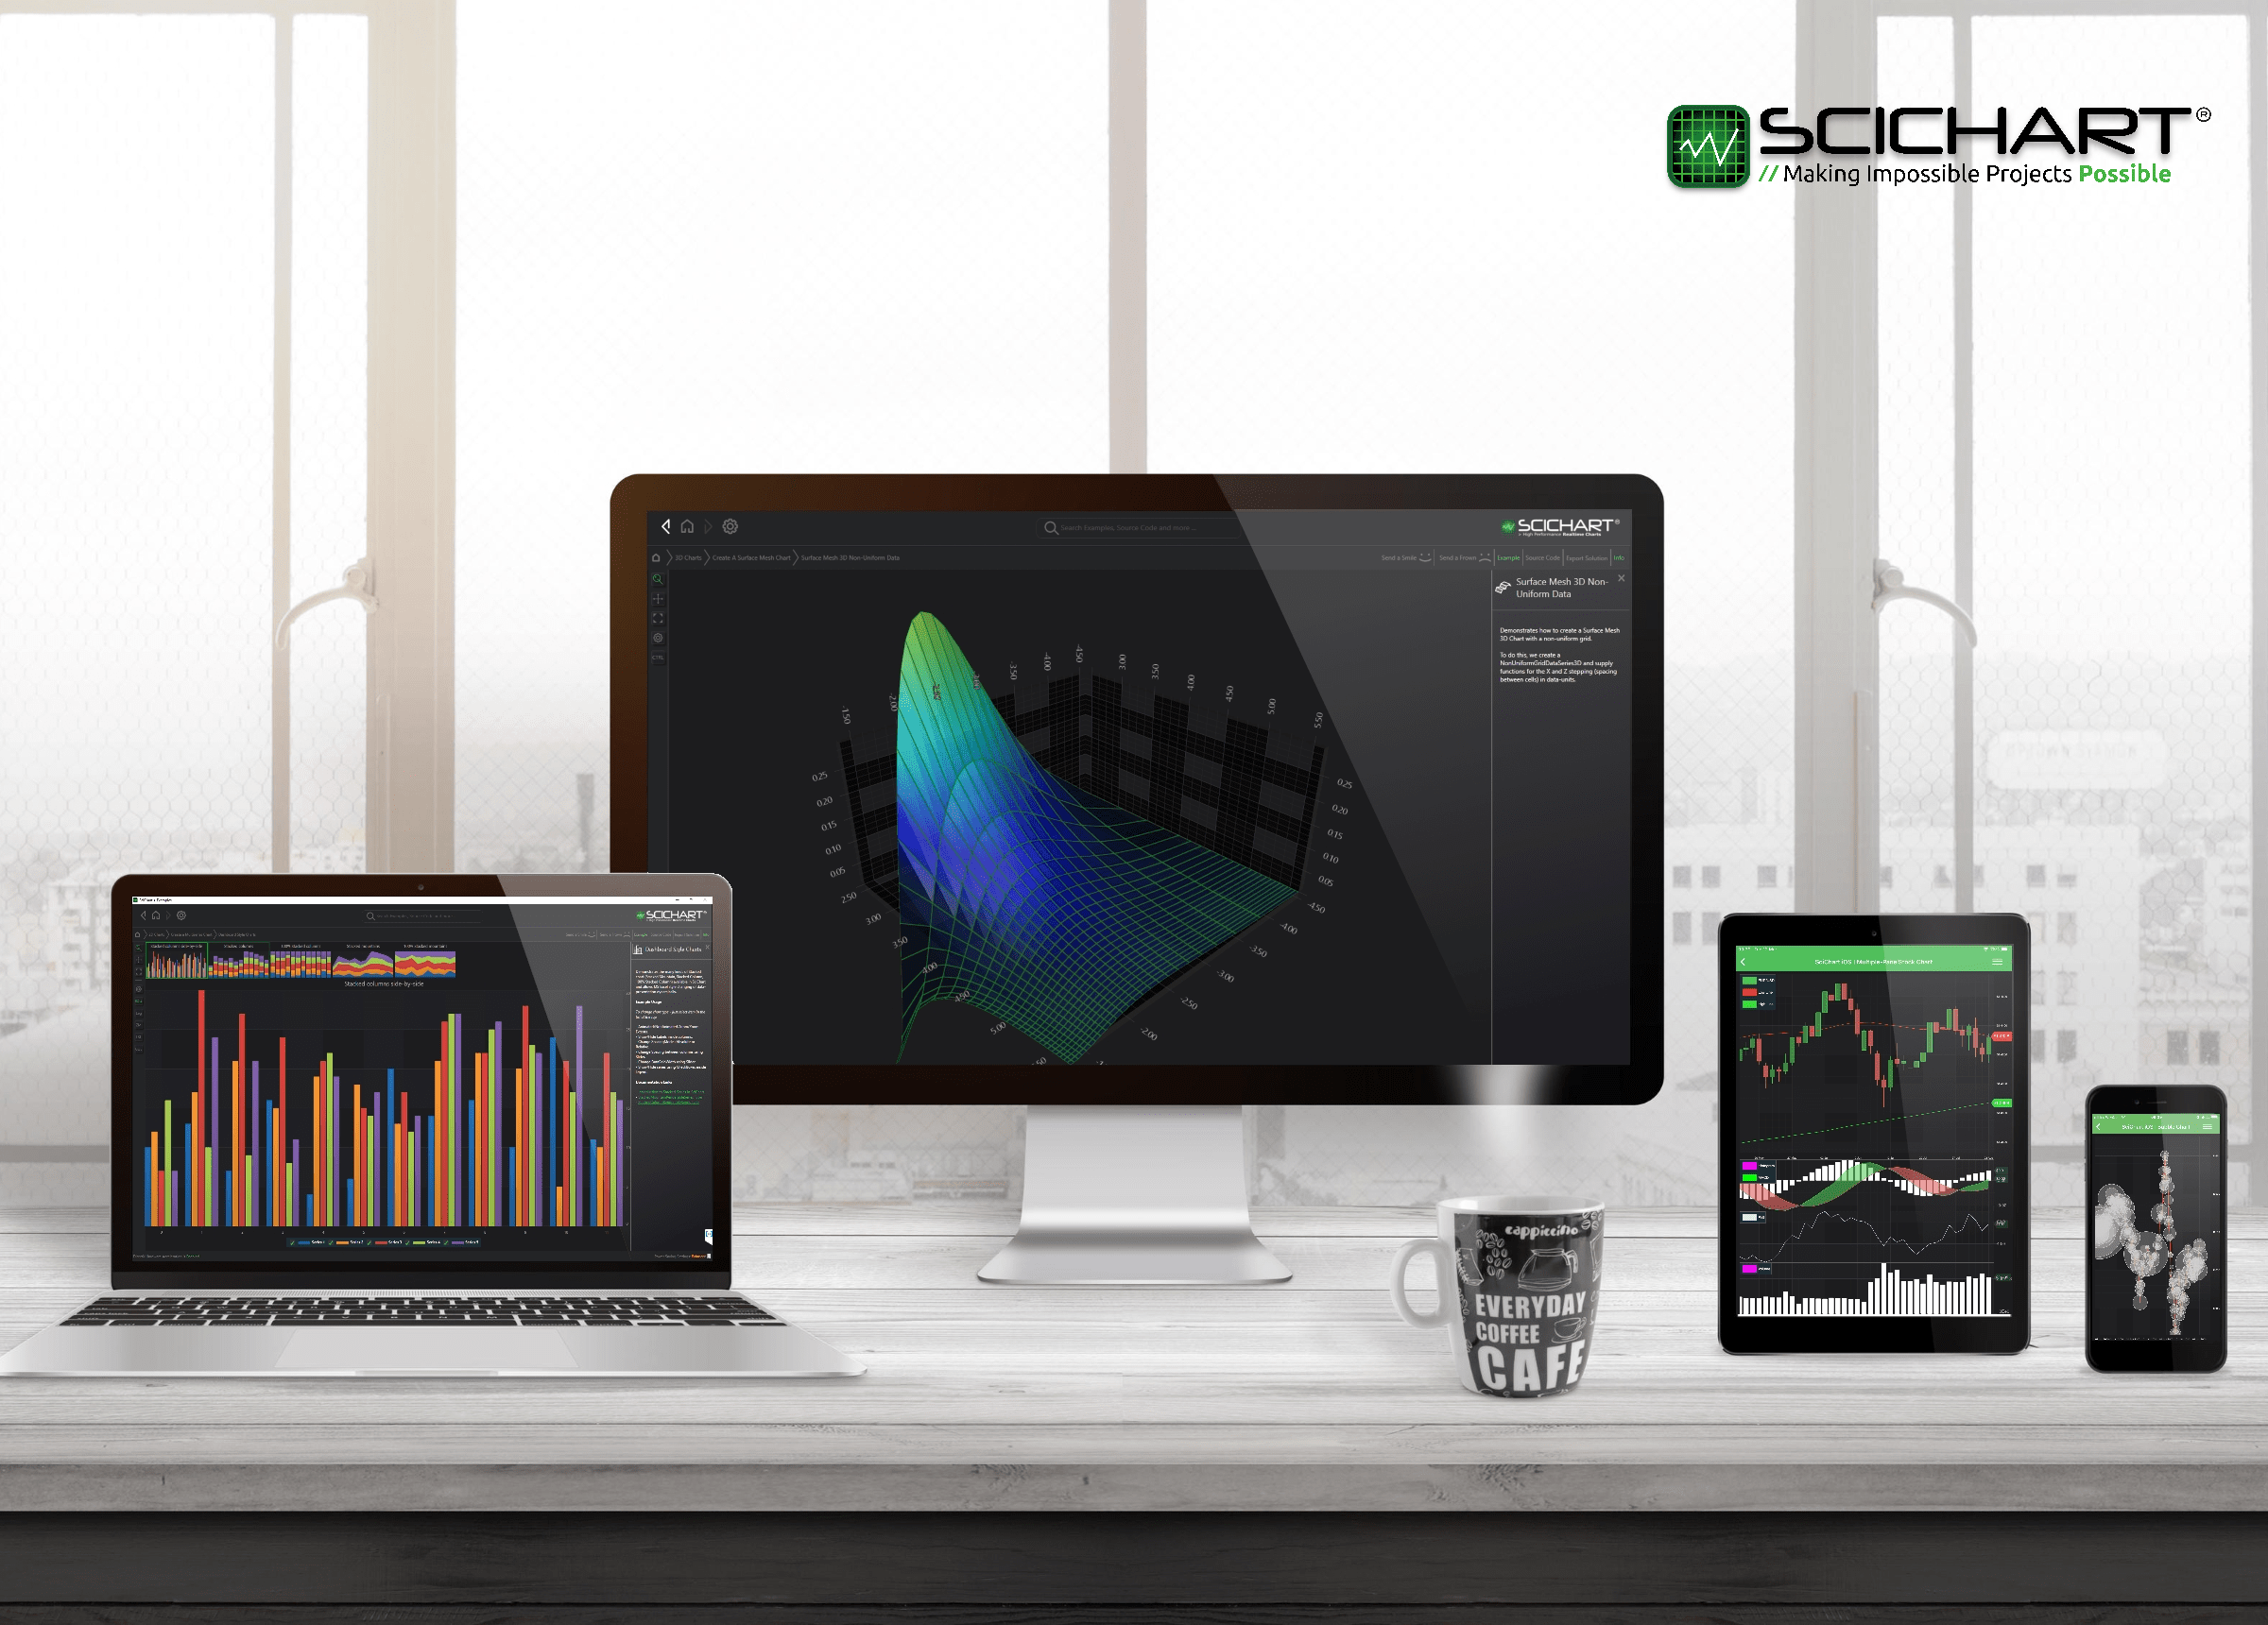
We’ve made lots of releases and updates in the past year in our WPF Charts, iOS/Android/macOS charts as well as JavaScript Charts. Take a look at the release notes recap below to see what’s new! If you are not up to date, then do take the opportunity to update. There have been loads of improvements.

WPF Chart Releases

In 2021 we had several releases for SciChart WPF Chart Library– our flagship product still used by thousands of developers worldwide. SciChart WPF enjoyed a strong year with the following milestones:

SciChart WPF 6.3 released in Jan 2021. This included

  • .NET 5 support
  • Heatmap Peak Detection
  • Audio Analyzer example
  • Label Provider example
  • Performance improvements
  • various bugs fixed and improvements

In July we released SciChart WPF v6.4, which included:

  • 3D Lighting modes
  • multiple axis markers for Series Value Modifier
  • off-screen export examples
  • plus multiple important bug fixes and improvements
Above: The Parallel Coordinate Plot type was released as part of SciChart WPF v6.5

SciChart WPF v6.5 was also released at the end of October 2021, another big upgrade, including:

  • Official Windows 11 Support
  • .NET Framework v6 Support
  • Parallel Coordinate Plot chart type
  • Uniform Data Series Chart Type – enabling ultra big-data applications where only Y-values are needed (X-values are evenly spaced)
  • Digital Logic Analyser example with up to 64 Billion Datapoints rendered.
  • Shared Render Timer for better chart synchronisation and performance in multi-chart applications.
  • Many other important bug fixes and improvements.
WPF Consultancy Projects

The WPF team also carried out several consultancy projects throughout the year. One was for a Formula One team, and we’ve blogged about SciChart’s use in F1 here and also here: Max, Data and Marginal Gains – Why You Can Only Optimise What You Can See

Above: SciChart is used by multiple F1 teams. We blogged about the importance of high performance, configurable charts in F1 and similar industries.

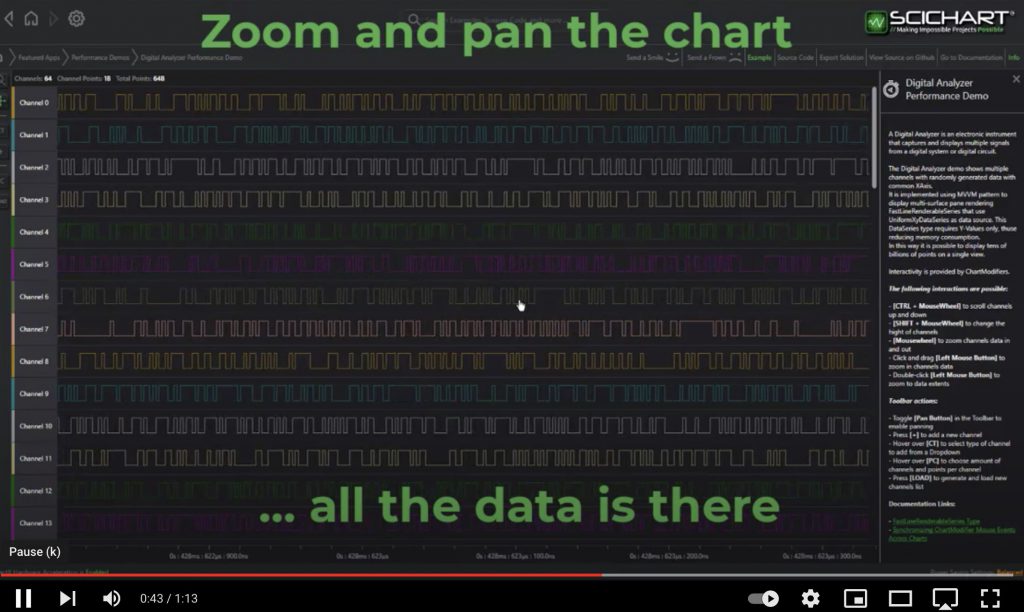
Another was an Electronic Test Measurement manufacturer, where our team built an entire app from scratch to display billions of data-points acquired from digital logic analyser. Case study coming on that soon, but in the meantime check out the new example we have in our WPF Chart Examples Suite – the Digital Analyzer.

WPF Performance

Several strides were made in performance this year as well. The introduction of UniformDataSeries allowed us to render massive datasets – up to 64 Billion Datapoints was demonstrated in this video.

We demonstrated up to 64 Billion data-points in a WPF Chart using our new UniformDataSeries, demonstrated in the Logic Analyser example.

Our team also re-evaluated performance vs. our strongest competitor, and blogged about performance test results. SciChart WPF is still by far the world’s fastest WPF chart control, in a wide variety of real-world test cases. Beware of claims to the contrary!

Above: Performance Test Results of SciChart WPF vs. our strongest competitor. In a wide range of real-world test cases, SciChart was found to be the fastest chart, in some cases several thousand percent faster! Read more at SciChart – The Fastest WPF Charts. Period. 2021 Test Results Update
WPF Process Improvements

Finally the WPF team also pioneered work in the analysis of tech-support requests, finding out what our most common problems were and adding automated testing to improve the quality around those areas.

Reducing our tech-support load by pre-emptively finding and fixing common issues and upgrading our build & deployment pipelines will give our team better efficiency in 2022 and beyond.

iOS/Android/macOS Chart Releases

Our native mobile charts had several releases this year, including:

SciChart IOS/Android v4.2, released in January which featured:

  • SeriesValueModifier
  • XCode 12 support
  • macOS Big Sur support
  • plus several bug fixes and improvements

The mobile team blogged about XCode 12 & Big Sur support here.

In July 2021, SciChart iOS/Android v4.3 was released. This release featured:

  • Major improvements to label formatting for financial/trading charts
  • Stacked series improvements
  • ability to modify an existing theme
  • and improvements to the Swift API for our iOS/macOS chart controls.
Objective-C frameworks in Swift's world (a.k.a. interoperability to Swift)
The mobile team improved our Swift API for iOS/macOS applications in July, enabling a much improved dev process for Swift app developers. Read more at the following blog post.

The mobile team blogged about the challenge/solution of the Swift API here. Something we discovered when creating the SciTrader App. The result of this work was a complete overhaul to our Objective-C / Swift interop, massively improving the usability of SciChart’s iOS Chart Library in Swift (macOS/iPad/iOS) applications.

The SciTrader App & SDK

In November 2021 the mobile team released the SciTrader App, a showcase application which you can download from the Apple App Store / Google Play Store.

The SciTrader App was released in Nov 2021: a native iOS/Android trading app. SDK / Financial Chart Library coming soon! Find out more at https://scitrader.io

In the future we plan to make this available as a financial chart library on both native iOS/Android and JavaScript.

You can learn more about SciTrader at https://scitrader.io or read our blog post on the SciTrader App & SDK

Kotlin Examples for SciChart.Android

Finally, in December we’ve now published the Android chart examples as both Kotlin and Java. These are viewable by cloning or downloading SciChart.Android.Examples on Github and will be on the website shortly.

JavaScript Chart Releases

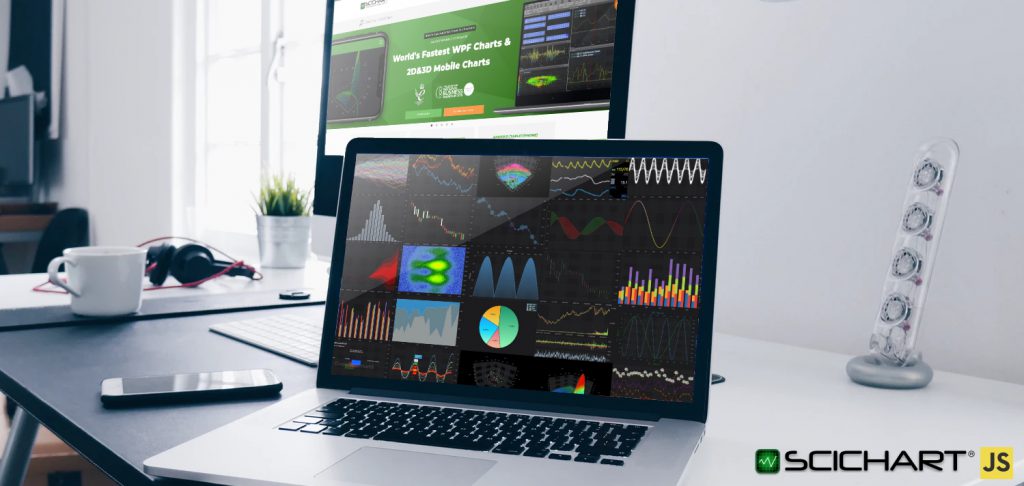
2021 was a big year for SciChart.js – our newest product – a high performance JavaScript/TypeScript WebGL chart library.

In Feb 2021 we released SciChart JavaScript v1.2, which included

  • Horizontal/VerticalLineAnnotation types
  • Editable / draggable annotations
  • Digital (step) Line, Band and Mountain chart types
  • styling of axis and chart borders
  • plus several bug fixes and improvements.

In March we released SciChart.js v1.3. This release featured:

  • Spline line series
  • Spline Mountain series
  • Spline band chart type
  • JavaScript Chart animations
  • Dashed line styling
  • plus several bug fixes and minor improvements.

We also updated the SciChart.js demo site at https://demo.scichart.com with a new look and style.

Two minor patches to SciChart.js: v1.3.1514 and SciChart.js v1.4 were released in April & May. These included:

  • critical bug fixes including memory leaks
  • new examples
  • new documentation
  • loading SciChart.js & Wasm from CDN for vanilla javascript support
  • pinch zoom and touchscreen support
  • as well as several minor improvements.
SciChart.js had several releases in 2021, including version 2 which added significant functionality to our JavaScript Chart Library

Finally in October we released SciChart.js version 2. We had been working on this all year and this major release included:

  • Series Selection
  • Datapoint Selection
  • Logarithmic Axis
  • Central and Inner Axis
  • Vertically Stacked Axis
  • Axis Label Customisation
  • The Builder API
  • JSON Serialization
  • Pointmetadata API
  • Filters and Data Transforms API
  • Style Animations and Data Animations
  • Transparent Backgrounds
  • Image Backgrounds
  • SciChartOverview control
  • Retina display Support
  • plus Miscellaneous improvements and all new documentation and examples.

Support Stats

That’s not all! A large part of what we do is supporting our customers. SciChart is rated 5* for technical support, and we respond to literally thousands of requests to ensure that you are able to build your projects without interruption.

SciChart handles thousands of support requests, forum questions and sales enquiries per year!

  • During 2021, our team efficiently managed 1,789 sales requests (8.1 per working day) 
  • 1,048 support tickets (4.7 per working day), each with tens of emails back & forth with tens of thousands of emails read & sent. 
  • As well as hundreds of forum questions
  • Hundreds of bugs fixed in SciChart WPF, iOS/Android and JavaScript
  • Hundreds of nightly build releases made across NuGet, Cocoapod/SwiftPM, Maven and npm. 

We’ve also made multiple improvements to our processes, testing and support including:

  • Updating and re-writing deployment scripts
  • Creating 5 Test Suites with hundreds of test-cases for automated and manual testing.
  • Developed metrics for quality assessment.
  • Analysed support load & frequently asked questions on our support desk.
  • Introduced testing plans & summary reports for every release.
  • Automated many manual test cases to reduce testing burden

All of this will improve quality of our work and efficiency so that we can continue to serve our customer base in 2022 and beyond.

Usage & Growth Stats

So it’s great that we’ve made so many releases, and answered so many support & sales requests, but who is using our software?

SciChart usage continues to grow: we saw a +25% Year on Year increase in licensing sales in 2021. This compounded on a +20% YoY increase in 2020. The number of users continues to grow and more and more impressive projects use SciChart.

SciChart is used by thousands of customers around the world, in cutting-edge research, technology, engineering & financial applications
  • This year SciChart became the defacto standard for F1, being used by the majority of top F1 teams.
  • Our software has powered research & development worldwide, including research into Covid-19 ventilators, cancer research.
  • SciChart is now used by over 150 educational institutions & universities, including MIT, Stanford, Imperial College.
  • Our trading application SciTrader is already at almost 3,000 monthly active users, despite launching only a couple of months ago.

We’ve made thousands of impossible projects possible with our software and continue to see amazing applications & services built with our chart libraries around the world.

What’s Coming in 2022

So what’s coming soon? We’re continuing to innovate and build out our cross-platform charting libraries. What you can look forward to in 2022 includes:

  1. We continue to develop the C++ core of our charts, enabling more features to be shared across platforms. For example, we have written the text label rendering entirely in C++ which will improve performance in our chart libraries across platforms and offer a unified experience for text rendering.
  2. Work like this can eventually can result in a C++ only version of SciChart but also enables WinUI, a new XAML technology which is built on top of C++ and wrapped by .NET. We are seeking companies who want to accelerate our roadmap for example into Linux or WinUI for native apps. If either project is valuable to you, get in contact and to discuss feature-sponsorship (roadmap acceleration): where we can focus resources and build dedicated features or platforms for you in exchange for a commitment fee.
  3. We continue to maintain our WPF charts, adding new features and continuously improving for our userbase.
  4. We are developing a financial charting library for adding SciChart into trading applications. The SciTrader SDK will be announced & released at some point in early 2022 and will support native iOS, Android as well as browser (JavaScript) apps.
  5. Our JavaScript charts will be developed to add more chart types, more demos and examples to showcase this powerful, high performance JavaScript chart library.
  6. We have a performance release for our JavaScript chart library due in early 2022 which will include more features from our Visual Xccelerator(TM) engine to allow tens of millions of data-points in realtime, faster loading & drawing.
  7. We are still taking feature requests, and working as consultants to integrate, customise our charts and build applications in scientific & financial fields. If expert consultancy is of interest to you, then contact us.
  8. Not only that but expect changes to our website, marketing & content as we continue to focus on growth in 2022 and beyond.

Finally, thank you to all our customers who have supported us this year, reviewed us, encouraged us and of course purchased from us. We hope to make you very pleased about your purchasing decisions in the coming 12 months!

Best regards,
Andrew

By Andrew Burnett-Thompson | Dec 30, 2021
CEO / Founder of SciChart. Masters (MEng) and PhD in Electronics & Signal Processing.Follow me on LinkedIn for more SciChart content, or twitter at @drandrewbt.

Leave a Reply

Try SciChart Today

Start a trial and discover why we are the choice
of demanding developers worldwide

Start TrialCase Studies