DirectX Compatibility in WPF Charts with SciChart
SciChart now features an optional DirectX10 based renderer. This is currently included as an add-on to the SciChart High Performance […]
We are pleased to announce that the SciChart WPF v6.4 build 13629 has now been released! This update includes new features, a number of bug fixes, and minor enhancements requested by users since version 6.3.x. This release is a drop-in replacement for 6.x and it is recommended for all users to update.
Enabled UseAlternativeFillSource by default
We decided to enable this option by default due to various stability issues when using the default D3DImage method in WPF. This was leading to some crashes of software running SciChart on some machines. You can find more info about this functionality in the article at the link below: https://docs.microsoft.com/en-us/windows/win32/direct3darticles/surface-sharing-between-windows-graphics-apis
Enabling UseAlternativeFillSource slightly changes the drawing pipeline. This method reads the rendered output back from GPU memory to main memory before setting it on a WPF image in a bitmap, sending it back to the GPU. The performance impact caused by this change is insignificant (about a millisecond on modern GPUs) and can be neglected.
To disable it please set static property VisualXcceleratorEngine.UseAlternativeFillSource to “False” anywhere in code.
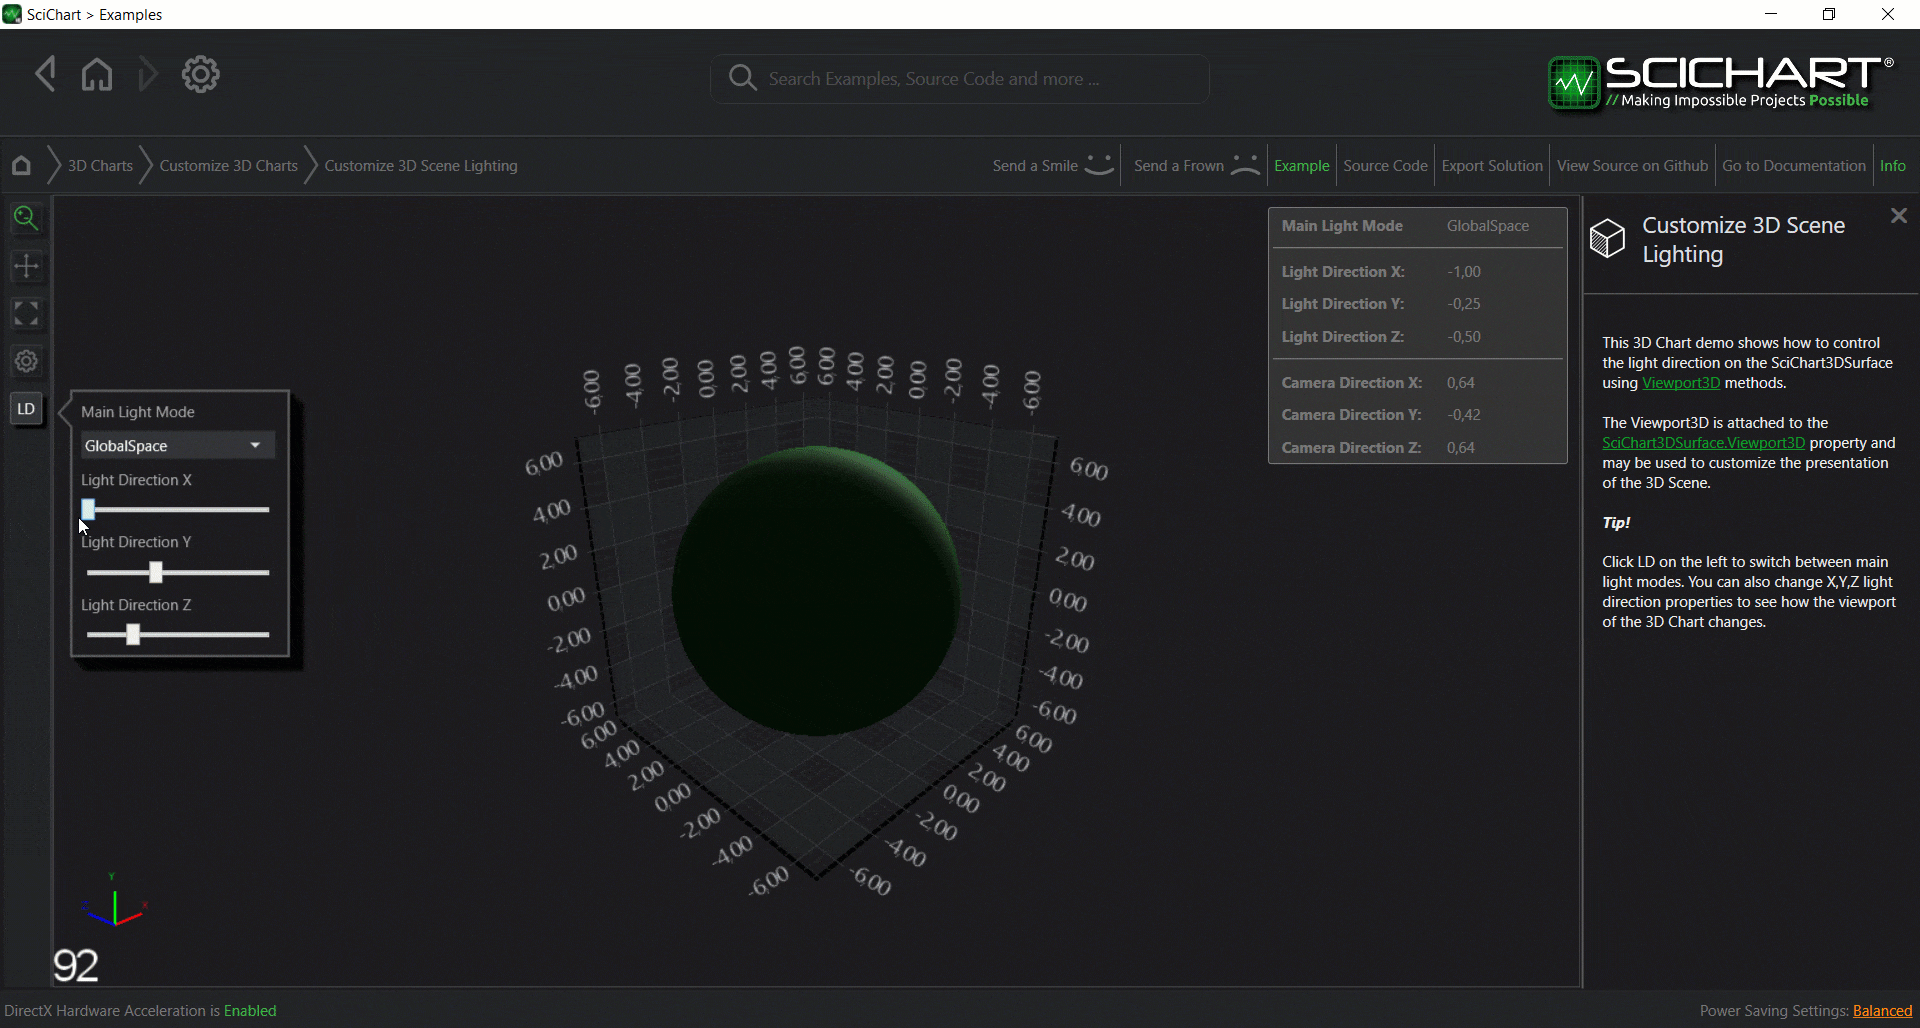
This feature introduces dynamic scene lighting to SciChart 3D. It allows users to control the light direction in 3D charts. It is enabled on the SciChart3DSurface using Viewport3D methods. The Viewport3D is attached to the SciChart3DSurface.Viewport3D property and may be used to customize the presentation of the 3D Scene.
To use it, you have to set LightMode to “GlobalSpace” on the current Viewport3D instance:
viewport.SetMainLightMode(MainLightMode.GlobalSpace);

Then LightDirection can be set as a vector in global space coordinates:

var vector = viewport.GetMainLightDirection();

vector.x = 0.25f;
vector.y = 0.5f;
vector.z = -0.5f;

viewport.SetMainLightDirection(vector);
The LightDirection vector is normalized, so its components can obtain values from -1 to 1.
You can try it in our examples demo. Clicking LD button on the left lets switching between main light modes. You can also change X,Y,Z light direction properties to see how the viewport of the 3D Chart changes.
Read the documentation on How to configure scene lightning in WPF 3D Chart with SciChart .
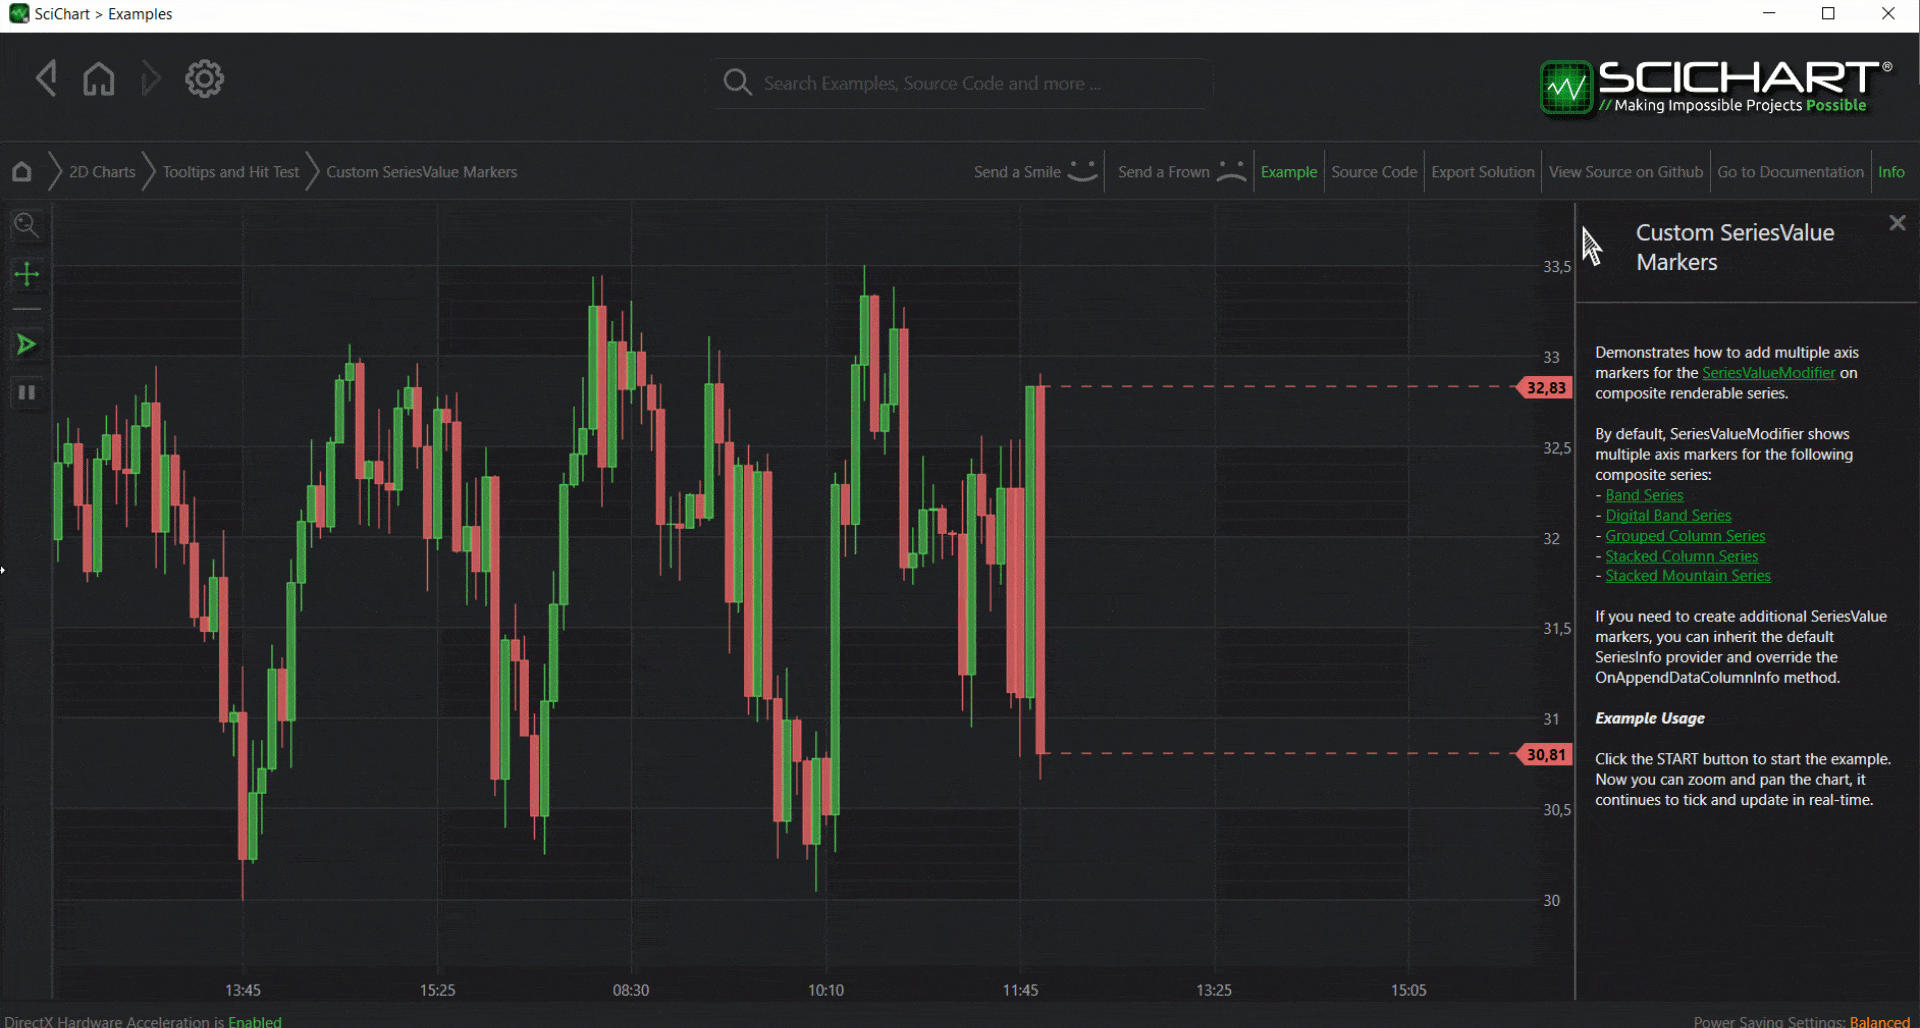
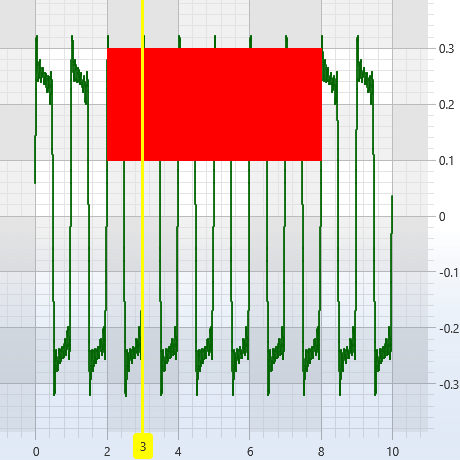
This feature allows adding multiple axis markers for the SeriesValueModifier on composite renderable series. By default, SeriesValueModifier shows multiple axis markers for the following composite series:
– Band Series
– Digital Band Series
– Grouped Column Series
– Stacked Column Series
– Stacked Mountain Series
If you need to create additional SeriesValue markers, you can inherit the default SeriesInfo provider and override the OnAppendDataColumnInfo method.
SeriesInfoProvider allows Modifiers to receive multiple information units from a single RenderableSeries. This is useful when there is a need to show several feedbacks, for instance, multiple AxisMarkers per one RenderableSeries with SeriesValueModifier. SeriesInfoProvider must implement the ISeriesInfoProvider interface and can be assigned to a RenderableSeries via the SeriesInfoProvider property.
Read the documentation on How to Use SeriesInfoProvider API in WPF 2D charts with SciChart.
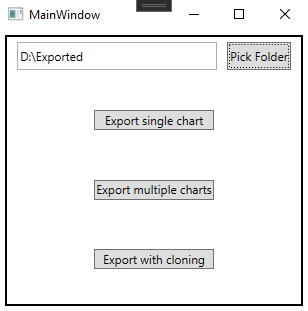
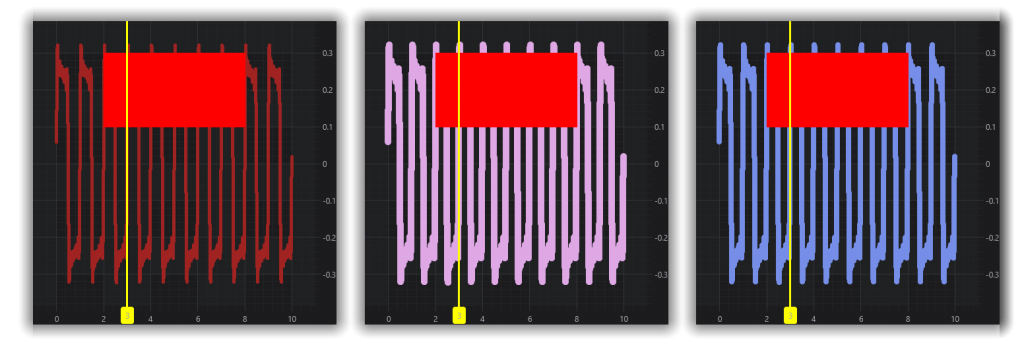
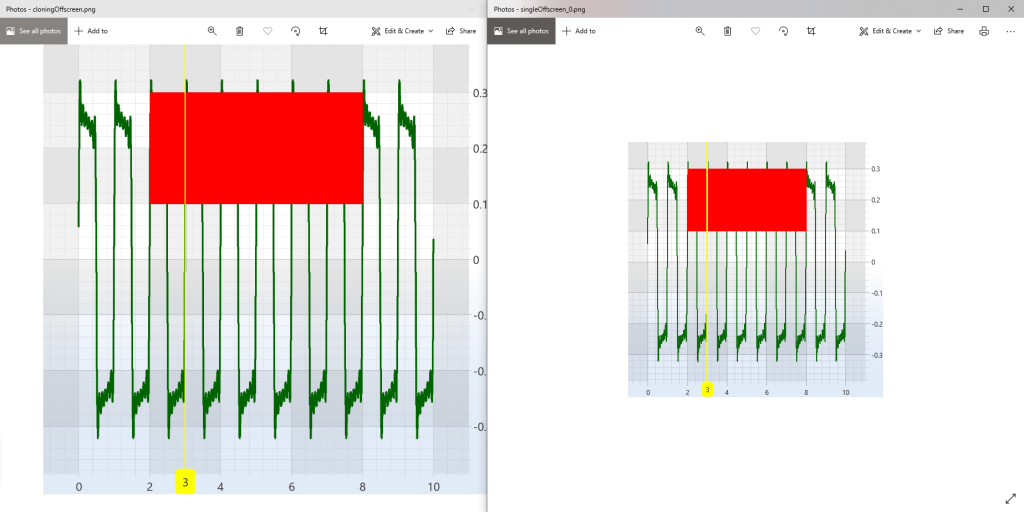
This is a very often asked question on our forums and support desk. Our team has created an off-screen export example that shows how to export a single chart, export multiple charts, and export with cloning.
Example UI and Single Chart Off-screen export
The example interface is simple and will save a png file of a chart that is created in code into the folder that you choose.
Export Multiple Charts
This exports multiple charts with different line thicknesses and colors, for example.
Export with Cloning
Allows exporting an image with a different size. When a user will be calling surface.ExportToFile(path, ExportType.Png, false, new Size(1200, 1200)), for example, will allow us to create a chart clone in code and then change its size. As the result, we can export a cloned chart of any size!
SciChart WPF Chart Library v6.4 is available by:
Please ensure you uninstall the previous version(s) of SciChart before installing the latest version as this can prevent some issues in the upgrade process!
SciChart WPF v6.4 is free of charge to customers with an active Support-Subscription.
For new customers, please find our pricing at our store page.
If your support has expired and you would like to get access to the improvements & fixes in this release, contact-sales and we will prepare you a renewal quote.
Best regards,
Julia
[SciChart Team]
Related Posts
![]()
Queens Award for Innovation
Proud winners of the Queens Award for Innovation, 2019. Awarded on account of our innovative graphics engine which underpins the SciChart library and enables our world-beating charting performance
![]()
National Business Awards
Highly Commended for Lloyds National Business Awards, 2019. Awarded on account of our innovative graphics engine and impressive customer base
![]()
National Technology Awards
Awarded “Healthcare Tech of the Year” at the 2025 National Technology Awards – a top UK recognition for breakthrough innovation in technology.

Reviews
SciChart has received hundreds of verified, 3rd party reviews