DirectX Compatibility in WPF Charts with SciChart
SciChart now features an optional DirectX10 based renderer. This is currently included as an add-on to the SciChart High Performance […]
We are pleased to announce that the SciChart WPF v6.5 build 13720 has now been released! This update includes a number of excellent new features, lots of stability fixes and performance & memory enhancements. This release is a drop-in replacement for 6.x and it is backward compatible for users of SciChart WPF version 6.
It’s always pleasant to bring SciChart to new platforms and runtimes. Even though in most cases SciChart WPF ‘Just worked’ on the latest version of Windows, we are delighted to announce SciChart WPF v6.5 now has official support of Windows 11. More to come later!
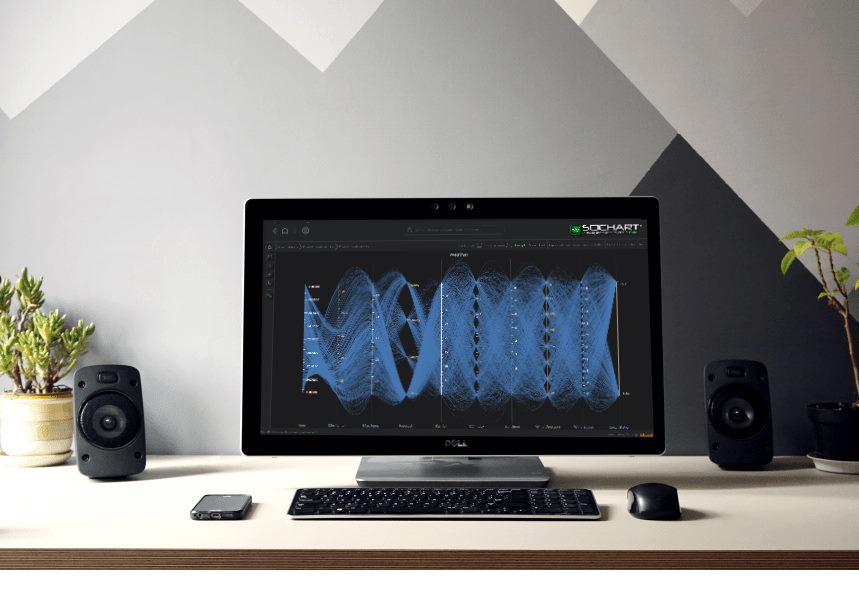
A feature request from an enterprise customer – we’ve added a Parallel Coordinate Plot to SciChart WPF. This is a chart type used for visualizing and analysing multi-dimensional statistical datasets. For example, it can be used to compare several sets of observations (represented by lines) of a combination of different factors (each represented by an axis) to find and visualize relationships between them.
In SciChart, the Parallel Coordinate Plot is represented by a new Control type called SciChartParallelCoordinateSurface. It is capable of rendering thousands of series or records, connected either by straight lines or splines. It is possible to have multiple Y-Axes representing different categories, each with a corresponding scale. Series may be selected. Individual styling of Y-Axes is also supported. Zooming, panning and Series selection is provided by corresponding ChartModifiers.
Another feature hotly requested on our Feature Request System. We’ve created a brand-new Data Series type called the UniformXyDataSeries. This uses Y-values only and assumes a fixed-stepping for X-Values. This saves 50% of the memory required in the most performance-intensive and demanding applications where data is sampled from data acquisition hardware, sensors or logic analysers.
The UniformXyDataSeries has already been road-tested in an application we built for a customer, which had to display up to Tens of Billion Datapoints of acquired binary and analogue data from a Logic Analyzer.
The UniformXyDataSeries is performant into the tens of billions of data-points for static datasets. With our templated DataSeries types it supports float, double, byte, short, int or long types, with a fixed stepping computed by sample number and step size.
Note: This series type has not yet been optimised for real-time but we plan to do that soon! When we have, we will be updating you with how to use it.
To show you the speed & power of the UniformXyDataSeries we’ve created a new demo – the Digital Analyzer Performance Demo.
Modelled after a generic “Logic Analyzer” application it shows how SciChart is capable of displaying tens, hundreds of millions of even tens billions of datapoints of digital data acquired from Data Acquisition hardware, sensors, telemetry or logic analysers for this special case of time series with evenly spaced X-values.
Run the example by running the SciChart WPF Examples Suite -> And searching for ‘Digital Analyzer’
Here’s a video below of me running the Digital Analyzer Demo with 64 Billion Datapoints of digital data, all on a mid-level workstation with 64GB RAM and 6-core processor.
In fact, we’ve tested this up to 100 Billion data-points on powerful workstations (requires 128GB RAM).
SciChart is very capable for this kind of extreme big-data visualization in logic or hardware analysers, digital analysers or data acquisition hardware. No tricks, no if’s, no buts. We’ve worked hard to ensure every step of our graphics pipeline is fully optimised, using low-level gaming technology to achieve our incredible fast performance.
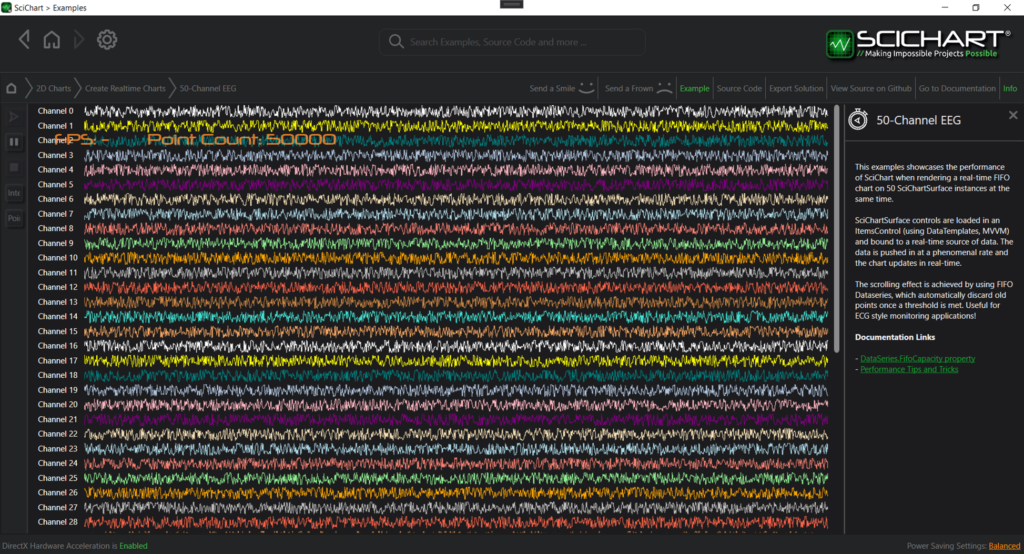
Some applications such as those with tens or hundreds of charts, or applications with SciChart WPF hosted inside WinForms or Win32 suffered from performance problems due to scheduling of our rendering on WPF’s UI Thread.
To solve this problem we’ve introduced a new SharedRenderTimer that allows to sync rendering between multiple SciChartSurfaces. It can be enabled or disabled by setting static RenderSurfaceBase.UseThreadedRenderTimer property anywhere in your code.
It is demonstrated in the “50-Channel EEG” example in our Demo App, which contains a ListBox with 50 SciChartSurfaces that are updated simultaneously.
Use of the SharedRenderTimer can improve performance significantly in some apps but is not recommended for default operation. If in doubt, contact our helpful, knowledgeable tech support team who will advise you how best to use SciChart in your application.
We have also added a huge number of tests for covering new features, improvements and updated documentation.
We have re-tested performance across a variety of chart types & features. SciChart WPF is still to our knowledge, the World’s Fastest WPF chart component, allowing for an order of magnitude or more performance gain against even the strongest competitor, when tested in a number of challenging and varied real-world use-cases.
With SciChart WPF Chart Library, you can be confident you are buying the best WPF chart on the market. Not only best performing in a variety of real-world use cases, but also the best API to work with, certainly the friendliest and most helpful staff when you need help :)
SciChart WPF v6.5 is available by:
Please ensure you uninstall the previous version(s) of SciChart before installing the latest version as this can prevent some issues in the upgrade process!
We welcome your feedback! Please let us know what you think about our new features, examples and improvements. You can contact our friendly, helpful team at any time!
Best regards,
Andrew
[SciChart Team]
Related Posts
![]()
Queens Award for Innovation
Proud winners of the Queens Award for Innovation, 2019. Awarded on account of our innovative graphics engine which underpins the SciChart library and enables our world-beating charting performance
![]()
National Business Awards
Highly Commended for Lloyds National Business Awards, 2019. Awarded on account of our innovative graphics engine and impressive customer base
![]()
National Technology Awards
Awarded “Healthcare Tech of the Year” at the 2025 National Technology Awards – a top UK recognition for breakthrough innovation in technology.

Reviews
SciChart has received hundreds of verified, 3rd party reviews