SciChart’s Cross-Platform Vision Complete!
SciChart has achieved a great deal in the past year, notably the pace of large releases has really increase in […]
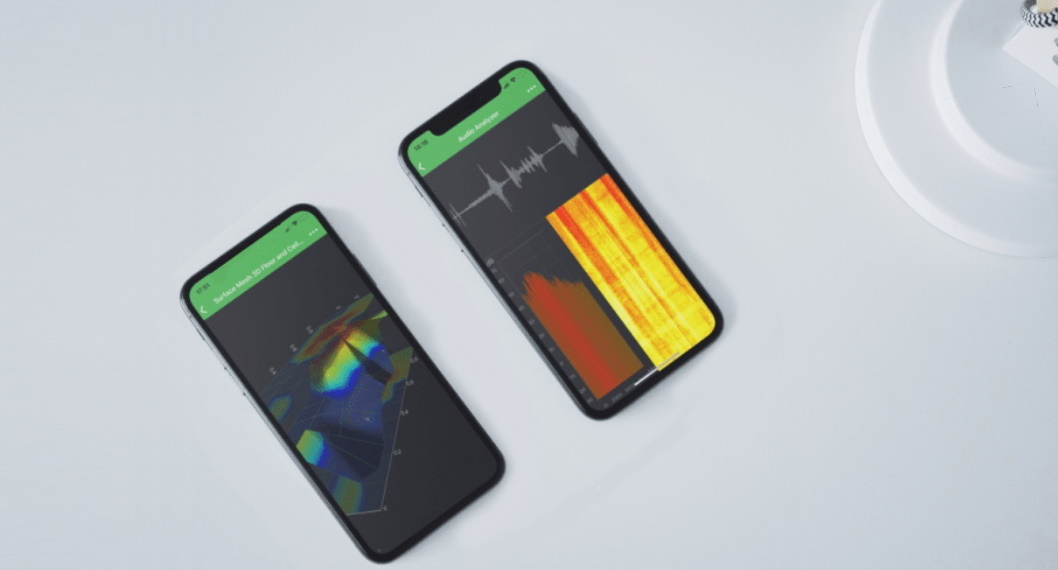
We are pleased to announce that the SciChart iOS, macOS, and Android v4.3, has now been released! It includes a lot of improvements and bug fixes. It is recommended for all users of SciChart to update to the latest version! Please see more information below.
This feature is extremely popular in financial and trading applications. When zooming the chart you can make the labels on x-axis automatically scale. This means that at a particular zoom level you can be showing years, but zooming in closer it will transform into months, dates, and so on.
Example: zooming changes from years to years and months labels on X-axis:
Example: zooming changes from months to month and dates labels on X-axis:
This is what has been improved:
DateFormatters for axis labels and for cursor labels, those are encapsulated in SCITradeChartAxisLabelFormatterdefaultTextFormatting for CategoryDateAxisRead more about how to use Axis Label Formatting for Finance and Trading Charts with SciChart.
There has been a number of improvements and edge cases fixed that were reported by customers. One of the improvements allows having a proper legend for the stacked series chart, like in the example below.
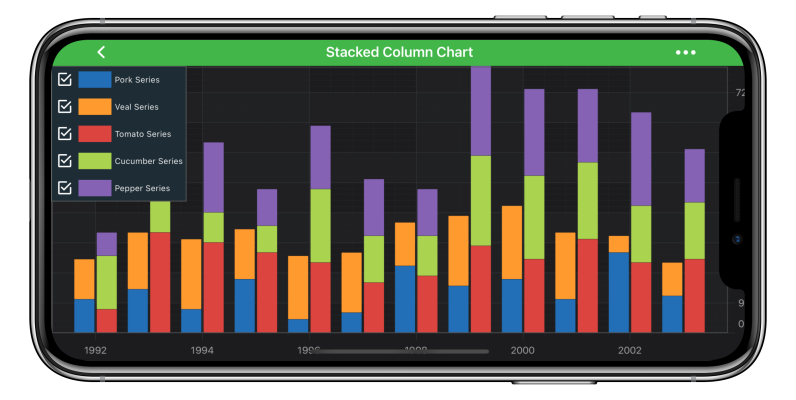
Some other changes and improvements for stacked series include:
The functionality to amend the exciting SciChart theme was already in our Android version and is added to SciChart iOS library with the release of v 4.3. In the previous version of SciChart, the user had to copy the theme and then define all the keys, whether they have been changed from default ones or not. With this release, users can create themes “basedOn” parent SciChart already existing theme and override only the keys that need to be different.
Below you can see how we styled a chart using exciting SciChart Theme v4 Dark (on the left). We have changed line series and labels colors, also background color. MinorGridlines color is changed so they seem not visible at all, as well as axisBandColor is changed. This is a very easy way to give your chart the look and feel that your design requires!
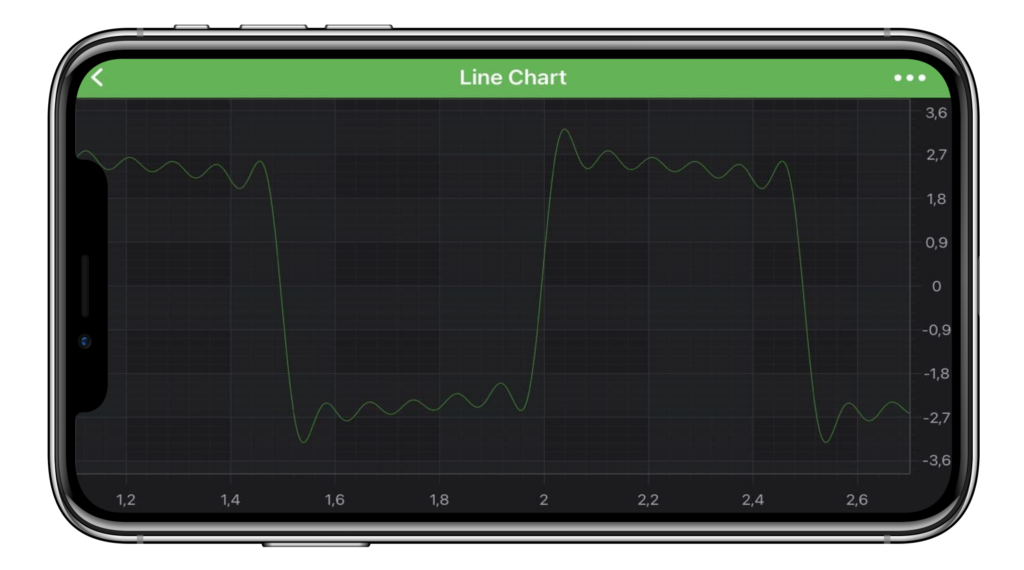
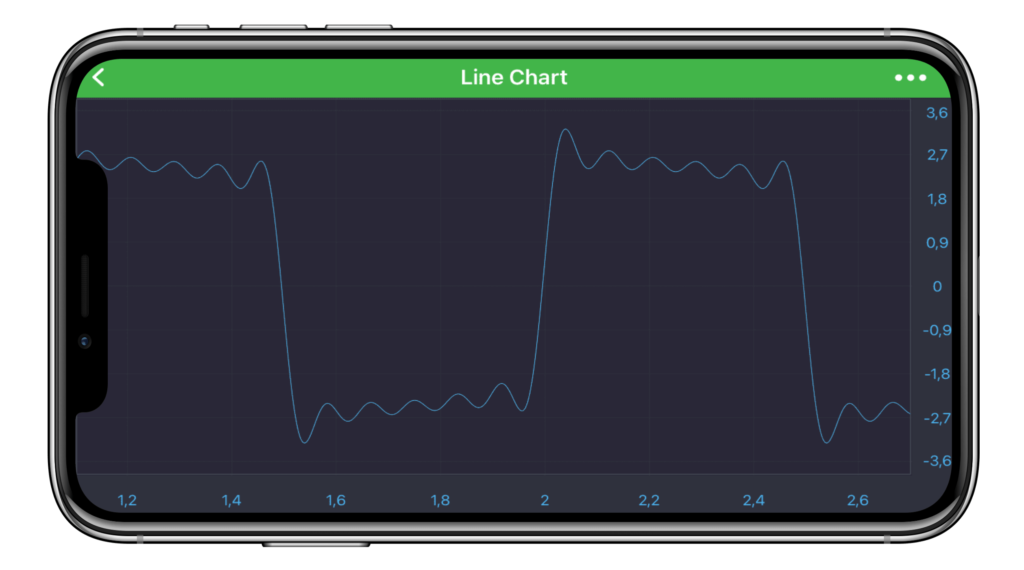
Read more about how to Modify a built-in Theme for iOS charts with SciChart.
Our team has been recently working on creating a financial charting component using SciChart iOS and SciChart Android. You can read about it in our blog post “Creating Native mobile Stock and Crypto Trading apps with SciChart – Preview“. Working on the iOS side we realized we can improve <a href="https://www.scichart.com/ios-chart-features/">SciChart.framework</a> consumption in the Swift world. Even though there is plenty of general knowledge about Objective-C to Swift and Swift to Objective-C interoperability we decided to go the extra mile and make improvements that are specific to SciChart iOS library.
Read our blog article Objective-C frameworks in Swift’s world (a.k.a. interoperability to Swift)
Some of the improvements are:
SciChart iOS/macOS and SciChart Android:
SciChart Android:
PinchZoomModifier which led to division by zero if delta was equal to zeroSeriesValueModifier annotations if using yAxis with non-default AxisIdCategoryDateAxisupdateCurrentPoint() signature in MasterSlaveTouchModifierBase to allow override of isMaster flag;RenderableSeriesProviderBase when isAttached was set to true instead of false on detach()ISciListCategoryDateAxis for conversion Date to point coordinate and vice versa insteadColorMaponDataSeriesChanged() call when setting DataSeries for RenderableSeries;CategoryLabelProviderBase to make it more thread-safeMotionEventManager implementation to better support case when motion events should work between chartsSciChartSurfaceBase to allow replacing default IPublishMotionEvents source which is passed with servicesgetPointRelativeTo() in IReceiveMotionEventGroup (this transformation moved to ModifierTouchEventArgs and performed relative to original source of event)SciChart iOS / macOS:
SCIPieChartTooltipModifier tooltips issueNSAttributedString with baselineOffset attributeSCIDrawableText size before drawing because TSRMetalTexture size can’t be zero.ISCIDataDistributionCalculator methods on ISCIDataSeries append/insert/updateNSDate, not double in SCIListDateSCIFastBubbleRenderableSeriesSCIView methods isPointWithinBounds worked incorrectlySCIChartSurface on certain iOS devicesSCIColorMap, added convenience initialisers in color extensionsdrawRoundedRects API to the ISCIRenderContext2DunsortedDataException to onUpdateXValues methodSCIDateValues APIs, especially for SwiftPerScreen to match Android and allow drawing line series with gradient styleCICollectionChangedEventArgs where new and old items should be readonly which also natively improves Swift APICIObservableCollection – now they obey to it’s collection generic typeonst float * pointers in ISCIRenderContext2D for drawing methods, to declare that memory should not be modified and better Swift interoperabilityYou can get SciChart iOS, macOS and Android from Downloads pages.
Separately you will need to download the Cross-Platform Licensing Wizard, required to activate and license SciChart Mobile SDK v3 and higher.
In addition, our example code is published to Github and is available to clone or download.
If your support has expired, Please contact sales asap to get a custom quote.
Best regards,
Julia
[SciChart Team]
Related Posts
![]()
Queens Award for Innovation
Proud winners of the Queens Award for Innovation, 2019. Awarded on account of our innovative graphics engine which underpins the SciChart library and enables our world-beating charting performance
![]()
National Business Awards
Highly Commended for Lloyds National Business Awards, 2019. Awarded on account of our innovative graphics engine and impressive customer base
![]()
National Technology Awards
Awarded “Healthcare Tech of the Year” at the 2025 National Technology Awards – a top UK recognition for breakthrough innovation in technology.

Reviews
SciChart has received hundreds of verified, 3rd party reviews