We are pleased to announce that the SciChart iOS, macOS, and Android v4.4, have been released! It includes a lot of improvements and bug fixes. It is recommended for all users of SciChart to update to the latest version! Please see more information below.
What is new in SciChart iOS/macOS/Android v4.4
In this minor release our team brings to you a bunch of cool stuff, including the following major improvements:
- Heavily requested examples written in
Kotlin(plusKotlin DSLextensions as a bonus) - iOS simulator finally supports Metal via corresponding render surface
- Brand new examples showcasing built-in Transformations API:
- Animate appending point in “Animating line chart” – iOS & macOS and Android examples
- Animate data updates in “Animating Stacked Column Chart” – iOS & macOS and Android examples
SciChart Android examples brought to Kotlin
Kotlin language becomes more and more popular and developers start using it much more in their projects nowadays. Not surprising that we were receiving lots of requests about samples written using exactly in Kotlin and not Java. Hence we spent some time and not only implemented examples but also added some Kotlin DSL extensions for the SciChart library, and now our simple LineChart Example looks like below:
override fun initExample(surface: SciChartSurface) {
    val fourierSeries = DataManager.getInstance().getFourierSeries(1.0, 0.1, 5000)

    surface.suspendUpdates {
        xAxes { numericAxis { visibleRange = DoubleRange(1.1, 2.7) } }
        yAxes { numericAxis { growBy = DoubleRange(0.1, 0.1) } }
        renderableSeries {
            fastLineRenderableSeries {
                dataSeries = XyDataSeries().apply {
                    append(fourierSeries.xValues, fourierSeries.yValues)
                }
                strokeStyle = SolidPenStyle(0xFF279B27)

                sweepAnimation { interpolator = DecelerateInterpolator() }
            }
        }
        chartModifiers { defaultModifiers() }
    }
}
full example available on our GitHub
And that’s it. With such a concise Kotlin snippet, you get your line chart with pinch, zoom and pan gestures out of the box.
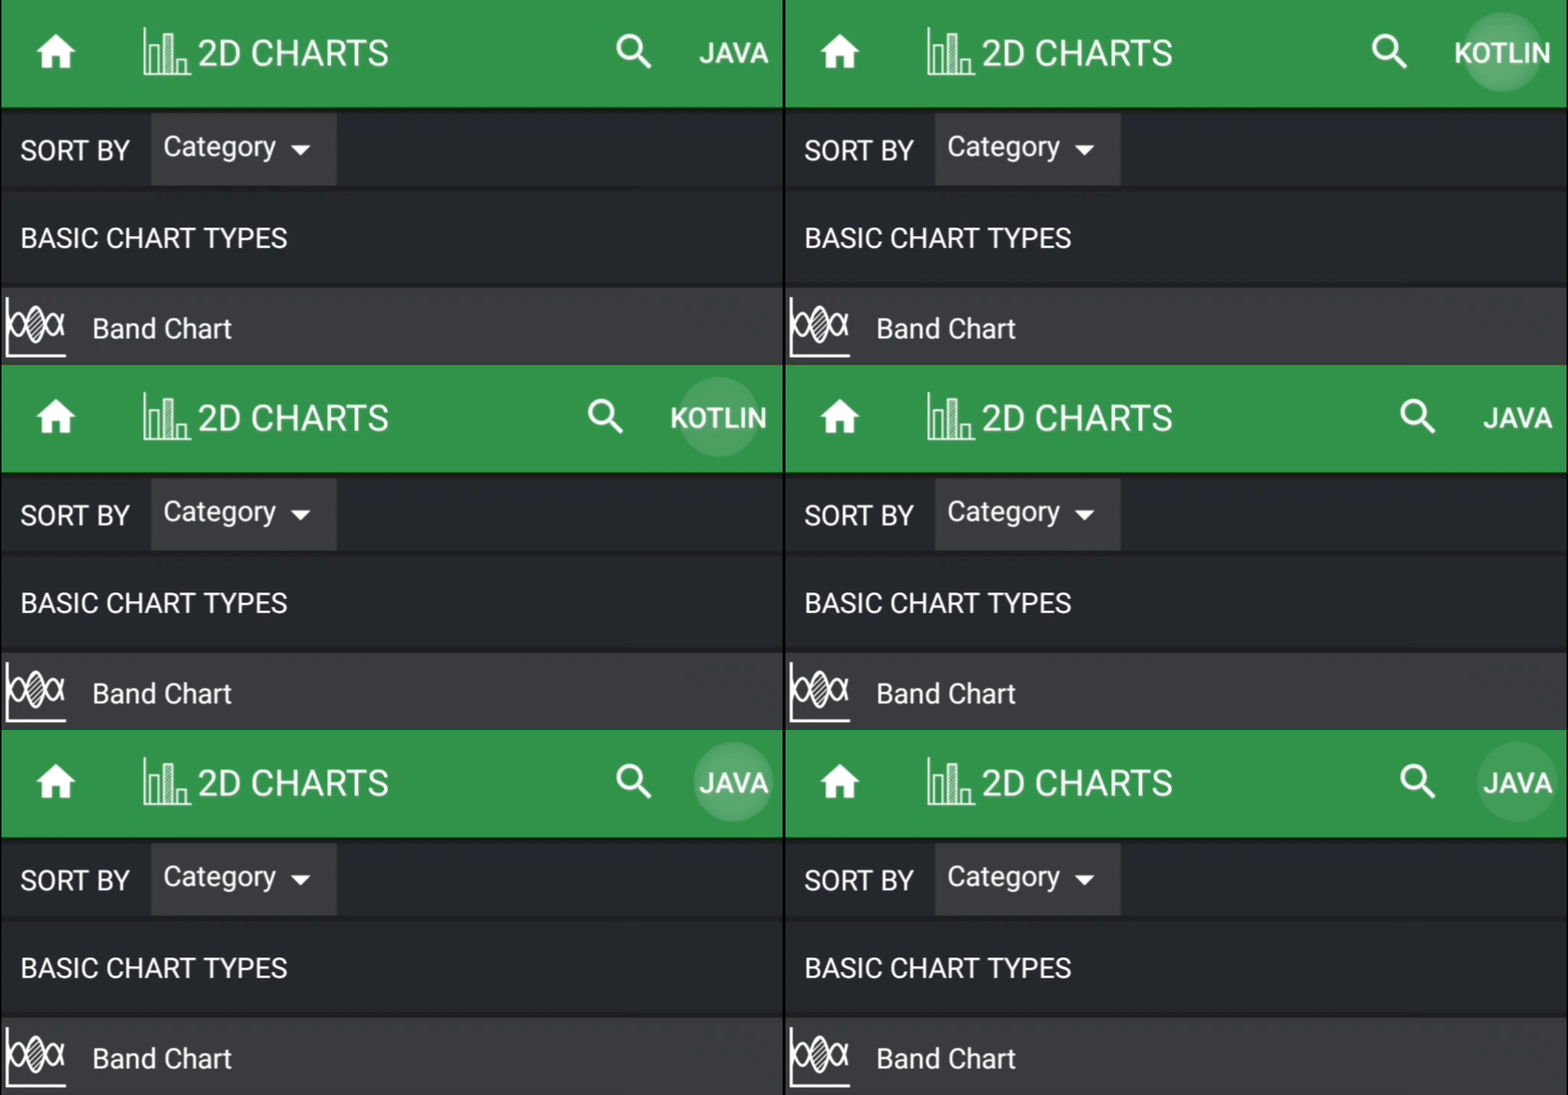
All of our examples are available in both – Java and Kotlin languages. Language can be switched by a simple tap in the application toolbar (try it out in our SciChart Android examples app), like so:

Moreover, all of the Kotlin DSLs are available in our public examples repository, so you can use those in your applications if you want.
Metal is finally available in the iOS simulator
This feature was requested very often. Some wanted just be able to test and debug applications directly on the host macOS machine, while others want to be able to automate screenshots while publishing to the AppStore. It doesn’t really matter what’s the real use-case, having Metal in a simulator is useful on its own, so we finally added Metal support for SciChart iOS which is running in a Simulator. It’s much more performant in comparison to OpenGL in simulator. It is super smooth for both – 2D and 3D charts – so we are glad it’s finally here:
Custom animation examples
Some of our customers would like to implement append data with animation instead of point just appearing on screen. Another would like to smoothly update existing data on a screen. Sometimes animations are very useful while visualising data. We do also receive requests about tricky custom animations. There were custom animations documentation available, but our underlying Transformations API is fairly vague and complex. So we added the following examples into our demo apps, to bring more light onto just mentioned APIs.
Animating Line Chart – iOS & macOS and Android examples
Animate data updates in “Animating Stacked Column Chart” – iOS & macOS and Android examples
Source code for our examples are as usual available in our GitHub repositories:
- iOS Animating Line Chart – Swift / Objective-C
- Android Animating Line Chart – Kotlin / Java
- iOS Animating Stacked Column Chart – Swift / Objective-C
- iOS Animating Stacked Column Chart – Kotlin / Java
Documentation about how to get the above result using Transformations APIs are available via the following links:
Other Improvements and bug fixes
SciChart Android:
- fixed PieChart gesture modifiers doesn’t work
- SC_DROID-810 – fixed incorrect HitTest results with FIFO series
- SC_DROID-813 – fixed creation pens with opacity
- SC_DROID-814 – fixed resizing of underlying primary target to correctly handle resizing of chart;
- SC_DROID-815 – fixed
NullPointerExceptioninSeriesSelectionModifier - SC_DROID-817 – fixed regression:
TooltipModifier3Dstopped working - fixed incorrect handling of opacity by canvas
RenderSurfacewhen rendering lines - improvements to underlying data distribution providers and resampling algorithms
- deprecated
ISmartList, becauseIDataDistributionProvider‘s flags should be outside it - added ported
CalendarUnitbased label formatter forDateAxis - refactored
PinchZoomModifier,RubberBandXyZoomModifierandZoomPanModifierto allow overriding for what exact X/YAxes the modifier should be applied - fixed
ZoomPanModifierwhich shouldn’t pan chart outside modifier surface - refactored
NiceDoubleScalecalculations to delay overflow of double which results Infinity results; removed generic param from delta calculator because it isn’t actually used - [examples] moved accessibility example to sandbox repository
- [examples] replaced show source code with redirection to GitHub for SciChar Android Examples
- [examples] deprecated export project feature
SciChart iOS / macOS:
- fixed
UIColorcategory methods are no longer conflicts withDynotracelibrary - added some missing
strongattributes - fixed missing
SCILineArrowAnnotationin examples - ported
CalendarUnitbased label formatter forSCIDateAxis - SCIOS-918 – embedded
dSYMandBCSymbolMapinto*.xcframework - improved some method signatures translate better to Swift
- exposed visible range animation related classes
- added missing
setVisibleRangeAnimator - refactored
SCIPinchZoomModifier,SCIRubberBandXyZoomModifierandSCIZoomPanModifierto allow overriding for what exact X/YAxes the modifier should be applied - fixed
drawNaNAsproperty that didn’t worked forSCIFastMountainRenderableSeries
SciChart Xamarin.iOS and Xamarin.Android:
- added missing
NullAllowedattributes and bindings - added missing constructor
SCIDefaultSeriesValueMarker - update bindings for
SCISeriesValueModifierandSCIThemeManager - lots of small underlying improvements for bindings
Where to get SciChart iOS / macOS / Android v4.4?
SciChart iOS & macOS
- iOS & macOS framework is available through both CocoaPods and Swift Package Manager
- SciChart iOS & macOS examples are available in AppStore
- SciChart macOS examples also available as
.dmginstaller - SciChart iOS & macOS examples sources are available on GitHub
- SciChart iOS & macOS source code is available on GitHub (source code customers only)
SciChart Android
- Android packages is available via maven feed
- SciChart Android examples are available in Google Play Store
- SciChart Android examples sources are available on GitHub
- SciChart Android source code is available on GitHub (source code customers only)
SciChart Xamarin.iOS and Xamarin.Android
- Xamarin.iOS package is available via NuGet
- Xamarin.Android package is available via NuGet
- Xamarin.Android 3D package is available via NuGet
- Xamarin examples sources are available on GitHub
- Xamarin source code is available on GitHub (source code customers only)
You can always get our SDKs for iOS, macOS and Android from our downloads pages:
Please Note: you will need to download the Cross-Platform Licensing Wizard separately, required to activate and license SciChart Mobile SDK v3 and higher.
Leaving Feedback
We welcome your feedback! Please let us know what you think about our new features, examples and improvements. You can contact our friendly, helpful team at any time!
If your support has expired, Please contact sales asap to get a custom quote.
Best regards,
Nazar
[SciChart Team]
Related Posts
