SciChart for Avalonia XPF v2.0 Released!
SciChart is thrilled to announce the release of SciChart for Avalonia XPF 2.0 – a major update that brings all features and improvements […]
It’ s been just 6 weeks since the final release of SciChart v3.0, but we have another release for you packed with features and improvements to the SciChart WPF Charting library. Full details of the improvements are listed below:
Usage:
[xml]
<!– Where s3D XML namespace is defined as –>
<!– xmlns:s3D=”https://schemas.abtsoftware.co.uk/scichart3D” –>
<s:SciChartSurface.RenderSurface>
<s3D:Direct3D10RenderSurface/>
</s:SciChartSurface.RenderSurface>
[/xml]
To find our more see our KB article High Speed vs. High Quality vs. DirectX Renderer Plugins.
New PerformanceDemo highlights key areas of performance
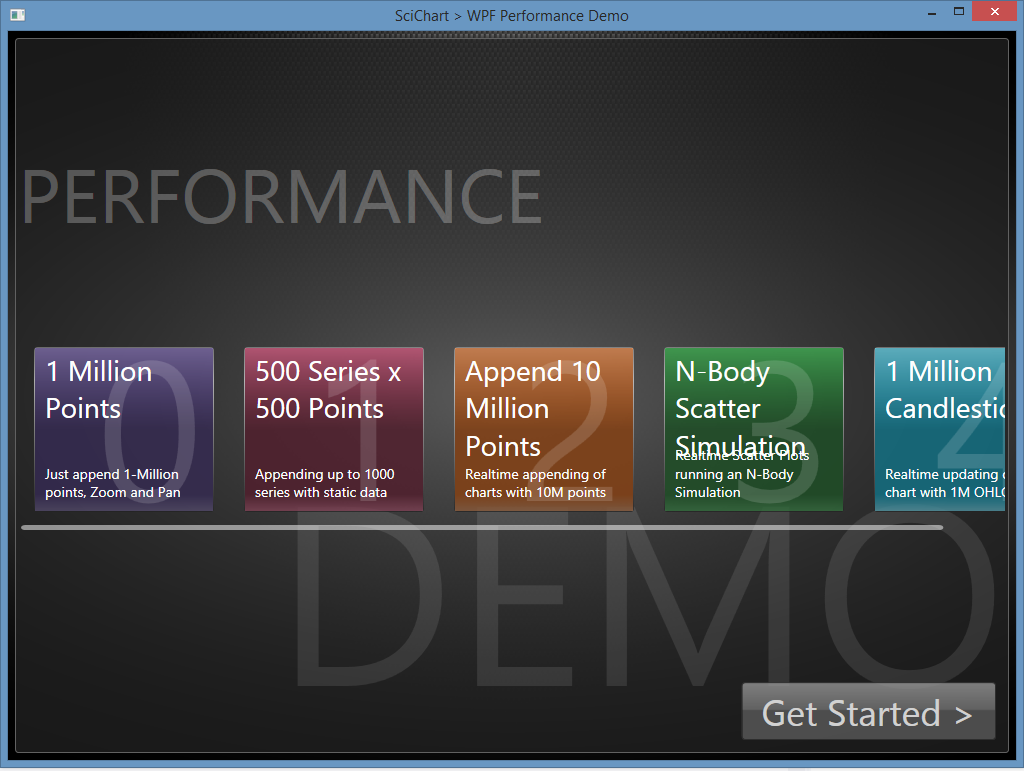
The Performance Demo can be started from the Start Menu. Search for ‘SciChart Performance Demo’. The source-code is also included in the WPF Examples Suite Solution in the install directory.
Usage:
[xml]
<Style x:Key=”GripStyle” TargetType=”Thumb”>
<Setter Property=”Background” Value=”Red” />
<Setter Property=”Foreground” Value=”Black” />
<Setter Property=”BorderBrush” Value=”Purple” />
<Setter Property=”BorderThickness” Value=”2″ />
<Setter Property=”Width” Value=”20″ />
<Setter Property=”Height” Value=”15″ />
<Setter Property=”Template”>
<Setter.Value>
<ControlTemplate>
<Ellipse Fill=”{TemplateBinding Background}” Stroke=”{TemplateBinding Foreground}” />
</ControlTemplate>
</Setter.Value>
</Setter>
</Style>
<s:BoxAnnotation Background=”Green”
BorderBrush=”Black”
IsEditable=”True”
ResizingGripsStyle=”{StaticResource GripStyle}”
X1=”2″
X2=”7″
Y1=”2″
Y2=”7″ />
[/xml]
Usage:
[xml]
<s:SciChartSurface.ChartModifier>
<s:ModifierGroup>
<s:RolloverModifier ShowTooltipOn=”MouseHover”/>
</s:ModifierGroup>
</s:SciChartSurface.ChartModifier>
[/xml]
[xml]
<s:SciStockChart IsRolloverEnabled=”True”>
…
</s:SciStockChart>
[/xml]
[xml]
<SciChart:LegendModifier x:Name=”legendModifier”
ShowLegend=”True”
LegendPlacement=”Top”
Orientation=”Horizontal”
ShowSeriesMarkers=”True”
ShowVisibilityCheckboxes=”True”
Margin=”10″ />
[/xml]
[xml]
<DataTemplate x:Key=”DefaultLegendMarkerTemplate” DataType=”r:BaseRenderableSeries”>
<Line Stretch=”Fill” X1=”0″ X2=”1″ Y1=”0.5″ Y2=”0.5″ StrokeThickness=”2″ Stroke=”{Binding SeriesColor, Converter={StaticResource ColorToBrushConverter}}” VerticalAlignment=”Center”/>
</DataTemplate>
…
<s:FastLineRenderableSeries LegendMarkerTemplate=”{StaticResource DefaultLegendMarkerTemplate}”/>
[/xml]
Usage
[xml]
<s:SciChartSurface.ChartModifier>
<s:ModifierGroup>
<s:SeriesValueModifier YAxisId=”RightAxisId”/>
</s:ModifierGroup>
</s:SciChartSurface.ChartModifier>
[/xml]
Usage
[xml]
<s:SciChartSurface.XAxes>
<s:NumericAxis AxisTitle=”Min”
Id=”axis1″
VisibleRangeLimit=”8000,9000″
VisibleRangeLimitMode=”Min” />
<s:NumericAxis AxisTitle=”Max”
Id=”axis2″
VisibleRangeLimit=”8000,9000″
VisibleRangeLimitMode=”Max” />
<s:NumericAxis AxisTitle=”MinMax”
Id=”axis3″
VisibleRangeLimit=”8000,9000″ />
<s:NumericAxis AxisTitle=”NoLimit” Id=”axis4″ />
</s:SciChartSurface.XAxes>
[/xml]
Usage
[xml]
<!– Define a DataTemplate for the Tooltip, which binds to SeriesInfo –>
<DataTemplate x:Key=”DefaulDataTemplate” DataType=”s:SeriesInfo”>
<Border BorderBrush=”Black” BorderThickness=”2″>
<StackPanel>
<TextBlock Text=”{Binding Value}” />
<TextBlock Text=”{Binding SeriesName}” />
</StackPanel>
</Border>
</DataTemplate>
<!– Define a DataTemplate for LineSeries, also binds to SeriesInfo –>
<DataTemplate x:Key=”LineDataTemplate” DataType=”s:SeriesInfo”>
<Border BorderBrush=”Black” BorderThickness=”2″>
<TextBlock Text=”{Binding Value}” />
</Border>
</DataTemplate>
<!– Apply a template Selector to the TooltipModifier –>
<s:TooltipModifier>
<s:TooltipModifier.TooltipLabelTemplateSelector>
<dataTemplateSelectors:CustomTemplateSelector DefaultTemplate=”{StaticResource DefaulDataTemplate}” LineDataTemplate=”{StaticResource LineDataTemplate}” />
</s:TooltipModifier.TooltipLabelTemplateSelector>
</s:TooltipModifier>
[/xml]
where the CustomTemplateSelector is defined as follows:
[csharp]
public class CustomTemplateSelector : DataTemplateSelector
{
public static readonly DependencyProperty LineDataTemplateProperty =
DependencyProperty.Register(“LineDataTemplate”, typeof (DataTemplate), typeof (CustomTemplateSelector), new PropertyMetadata(default(DataTemplate),OnCustomDataTemplateChanged));
private static void OnCustomDataTemplateChanged(DependencyObject d, DependencyPropertyChangedEventArgs e)
{
var selector = d as CustomTemplateSelector;
if (selector != null)
{
selector.UpdateControlTemplate();
selector.OnDataTemplateChanged();
}
}
public DataTemplate LineDataTemplate
{
get { return (DataTemplate) GetValue(LineDataTemplateProperty); }
set { SetValue(LineDataTemplateProperty, value); }
}
public override DataTemplate SelectTemplate(object item, DependencyObject container)
{
// Choose which template to serve depending on Series Type
var seriesInfo = item as SeriesInfo;
if (seriesInfo != null && seriesInfo.RenderableSeries.GetType() == typeof (FastLineRenderableSeries))
return LineDataTemplate;
return base.SelectTemplate(item, container);
}
}
[/csharp]
Following on from the example above, the same technique can be applied to Axis Cursor Labels by creating a DataTemplate with DataType of AxisInfo.
Usage:
[xml]
<Style x:Key=”AxisInfoTemplateSelectorStyle” TargetType=”s:AxisInfoTemplateSelector”>
<Setter Property=”YAxisDataTemplate”>
<Setter.Value>
<DataTemplate />
</Setter.Value>
</Setter>
<Setter Property=”XAxisDataTemplate”>
<Setter.Value>
<DataTemplate DataType=”s:AxisInfo”>
<Border BorderBrush=”Black” BorderThickness=”2″>
<TextBlock Text=”{Binding AxisFormattedDataValue}” />
</Border>
</DataTemplate>
</Setter.Value>
</Setter>
</Style>
[/xml]
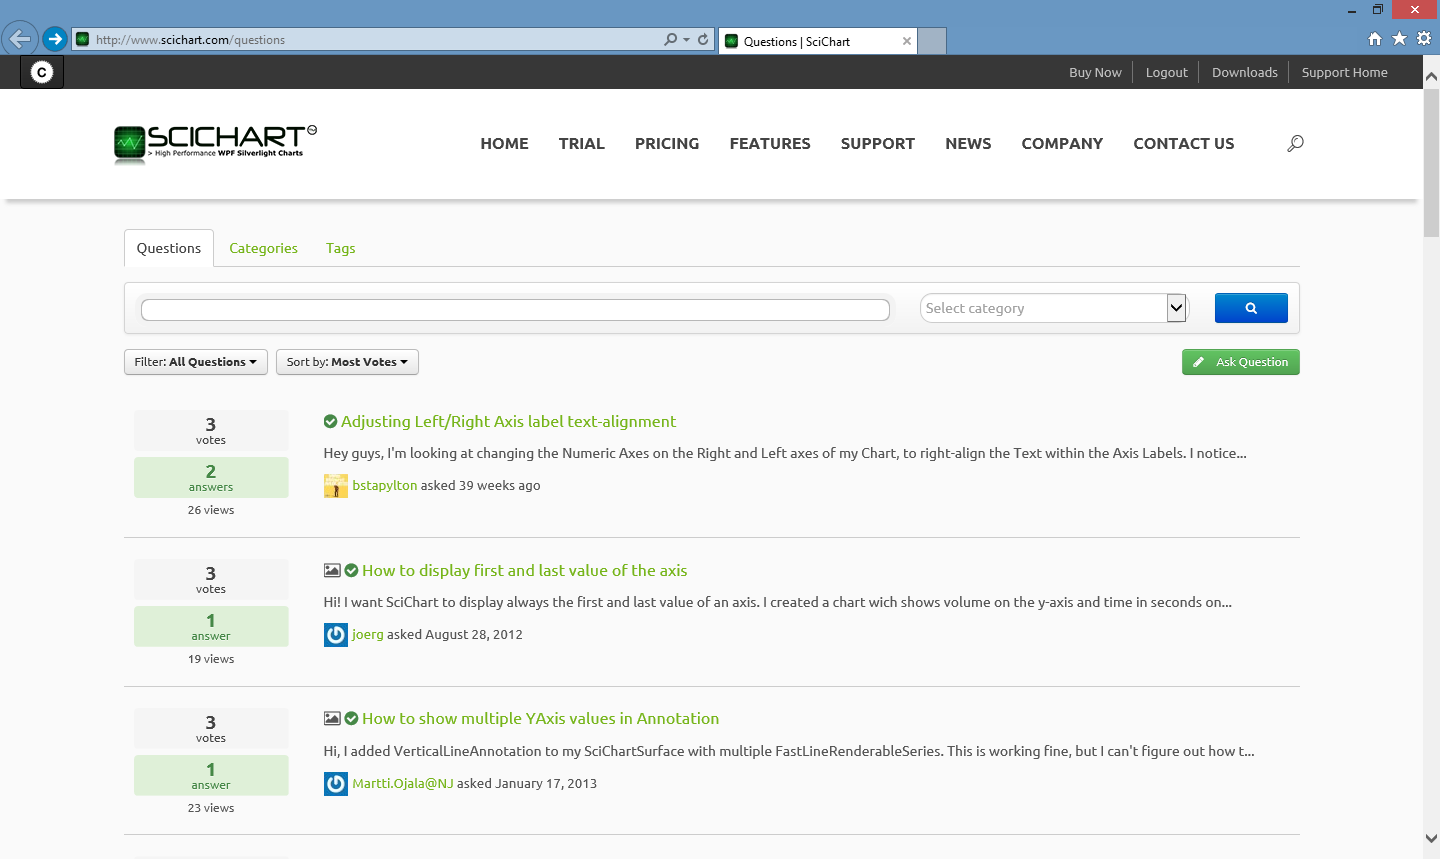
We have built in-house a proprietary site-wide search engine known as ‘Sci-Search’. This is available at search.scichart.com.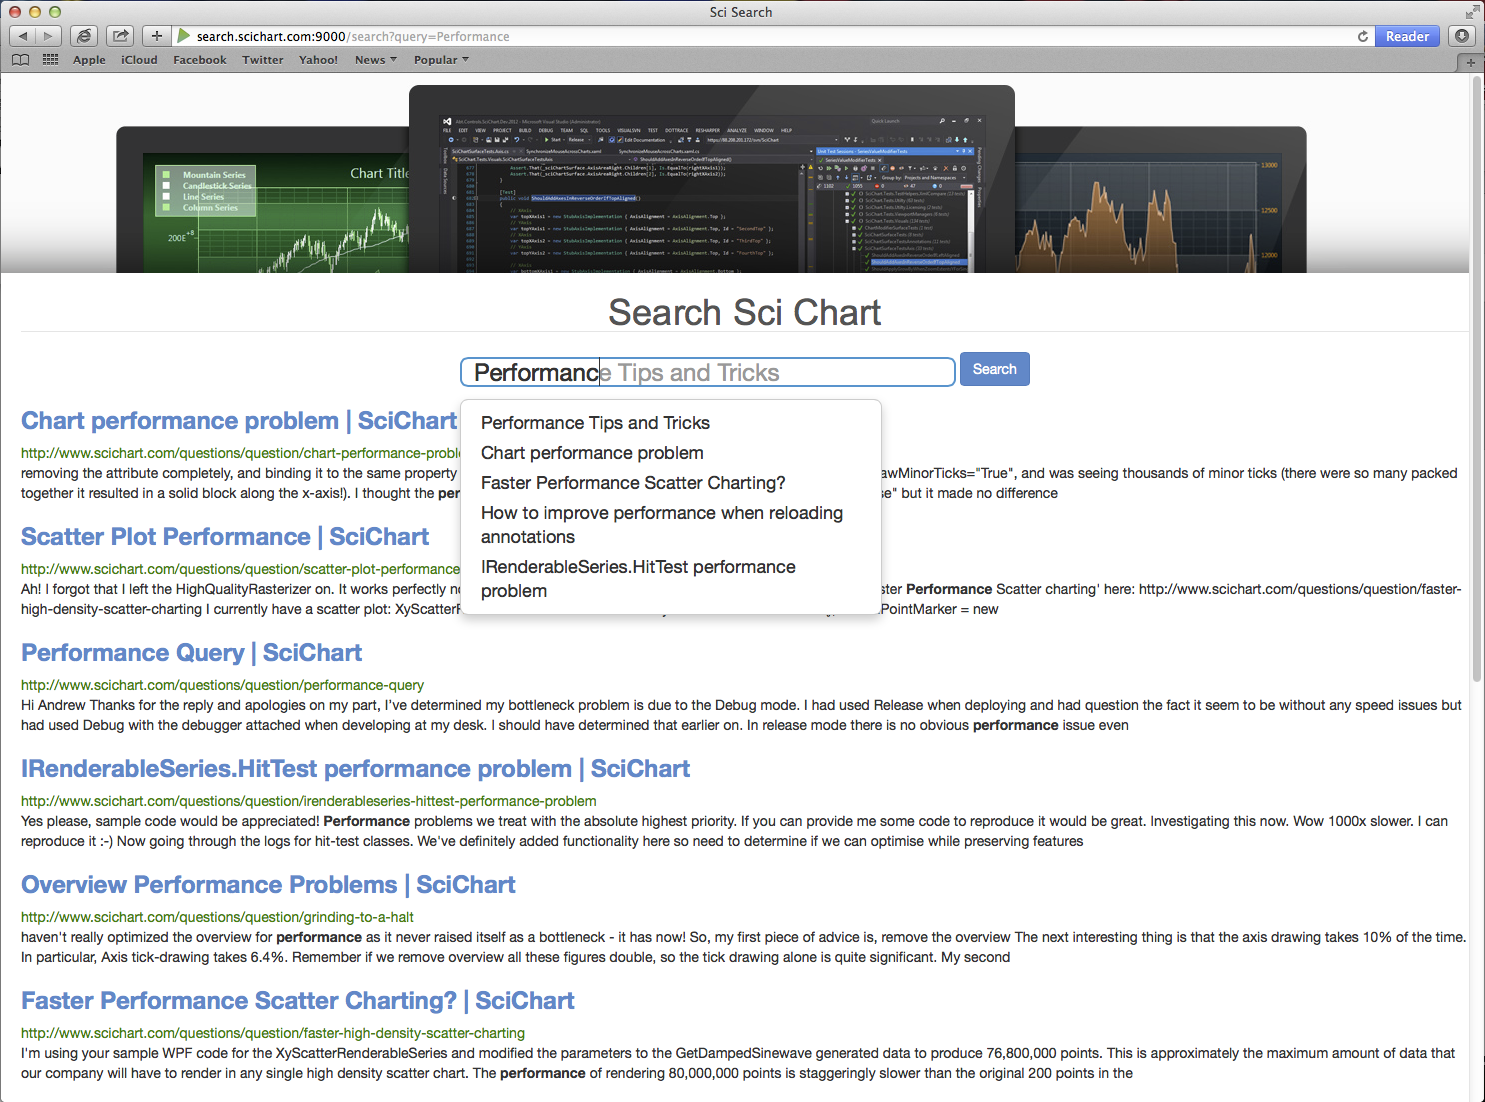
See the Release Notes for full details. We’ve fixed loads of bugs that you have reported to us over the past 6 weeks.
 Guess what? We have setup our Teamcity instance to deploy a nightly build to a private NuGet feed for SciChart v3.1. Every night at 1am UTC, if there are changes in our repository, all the tests pass and the build is green, our build server will deploy a nightly build of SciChart.WPF and SciChart.SL to a private NuGet feed.
For more information how to set this up, see the KB article Getting Nightly Builds with NuGet.**
We are continuing to improve our products & services, starting with SciChart and moving on to SciChart 3D. We feel the library is quite mature now, but there is still so much we want to do with it. As you invest in us, we will continue to invest in you. So keep the feedback coming and we will keep the releases coming. Thanks for being with us so far! :)
*Licensing Restrictions for the DirectX10 Renderer
**Notes on the Nightly Build Feed
Related Posts
![]()
Queens Award for Innovation
Proud winners of the Queens Award for Innovation, 2019. Awarded on account of our innovative graphics engine which underpins the SciChart library and enables our world-beating charting performance
![]()
National Business Awards
Highly Commended for Lloyds National Business Awards, 2019. Awarded on account of our innovative graphics engine and impressive customer base
![]()
National Technology Awards
Awarded “Healthcare Tech of the Year” at the 2025 National Technology Awards – a top UK recognition for breakthrough innovation in technology.

Reviews
SciChart has received hundreds of verified, 3rd party reviews