
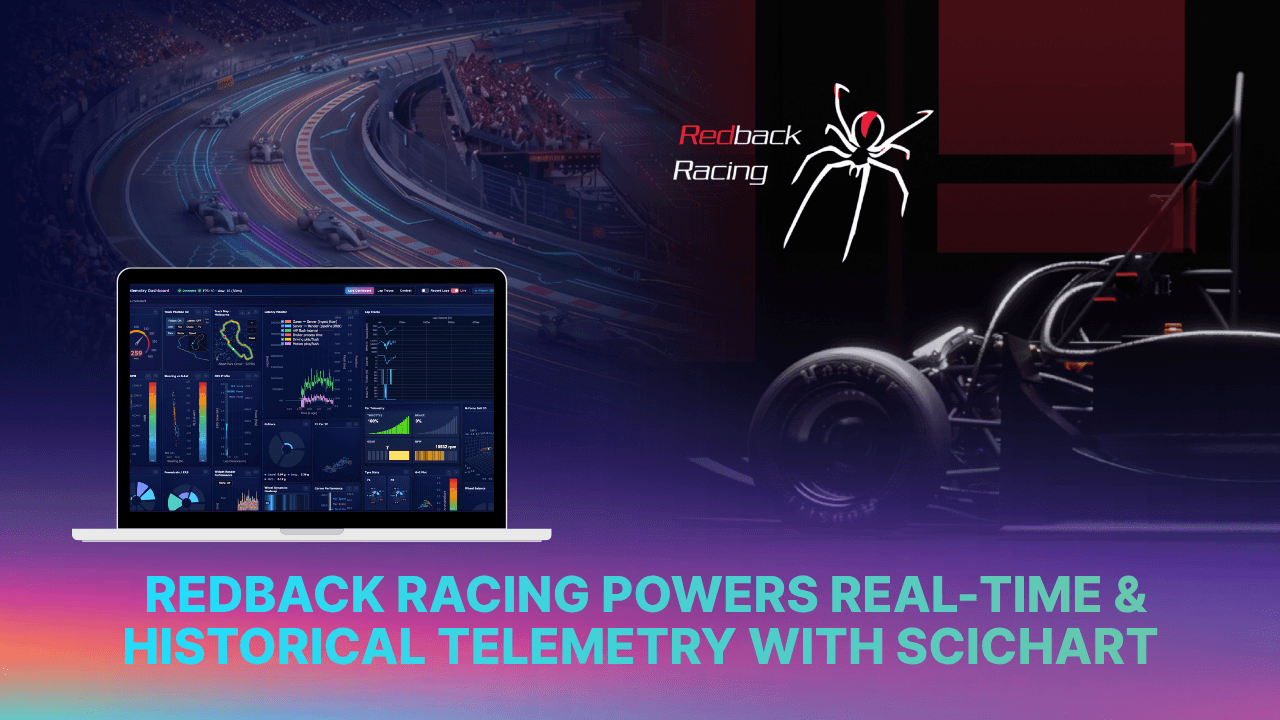
Industry: Motorsport and engineering education
Platform: React
About Redback Racing
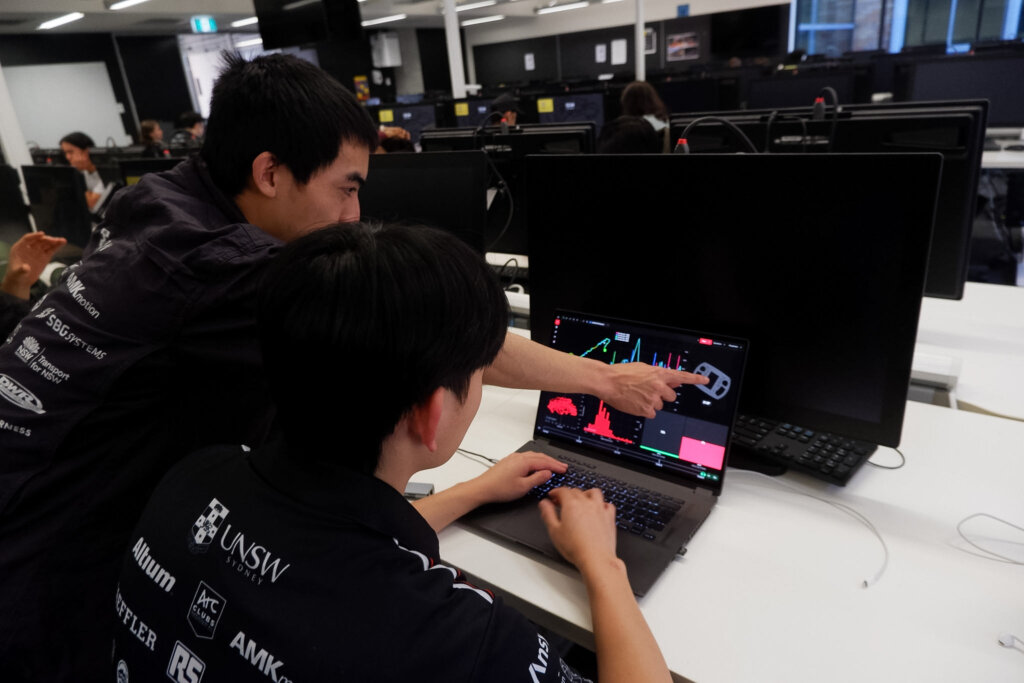
UNSW Redback Racing is the University of New South Wales’ Formula Student team. Each year, the team designs, builds, and races an all-electric car at Formula SAE-A. This annual student motorsport design competition involves as many as 35 university teams across Australasia. The best-performing formula-style vehicle wins. Since its inception in 2000, it has come a long way and now increasingly champions electric vehicles, with self-driving vehicles also now gaining traction.
Amidst all these changes on the track, UNSW Redback Racing wanted to continue being a competitive presence. However, there was something standing in their way: how to present increasingly complex datasets to make split-second decisions on the track and more informed decisions off the track.
That’s when they came across SciChart, and our work with the leading F1 teams as well as student Formula racing teams.
The Challenge: Scaling a Custom Charting Solution
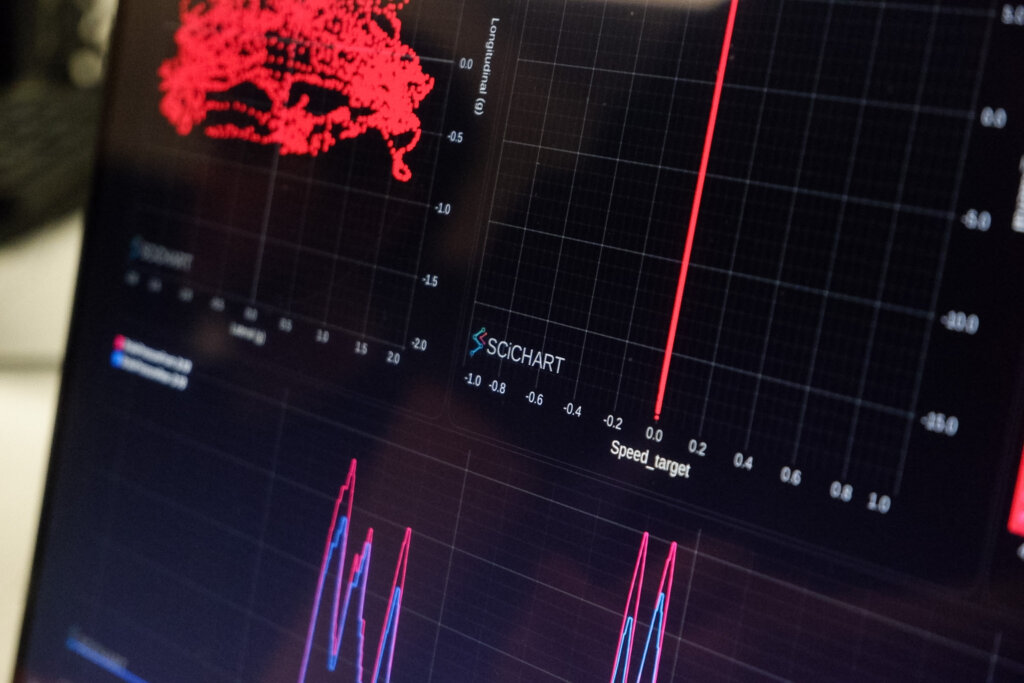
Redback Racing’s Vehicle Analytics team built their very own in-house telemetry platform, Spyder. Engineers use Spyder trackside to monitor battery temperatures and powertrain data. Drivers rely on it to review previous runs and share feedback with the vehicle dynamics team.
The team previously used a custom charting solution. However, as datasets grew larger and more complex, historical analysis became increasingly difficult.
To stay responsive, the team needed to separate chart implementations for live and historical telemetry. The downside was that this added complexity and maintenance overhead.
The Solution: One Component for Live and Historical Data
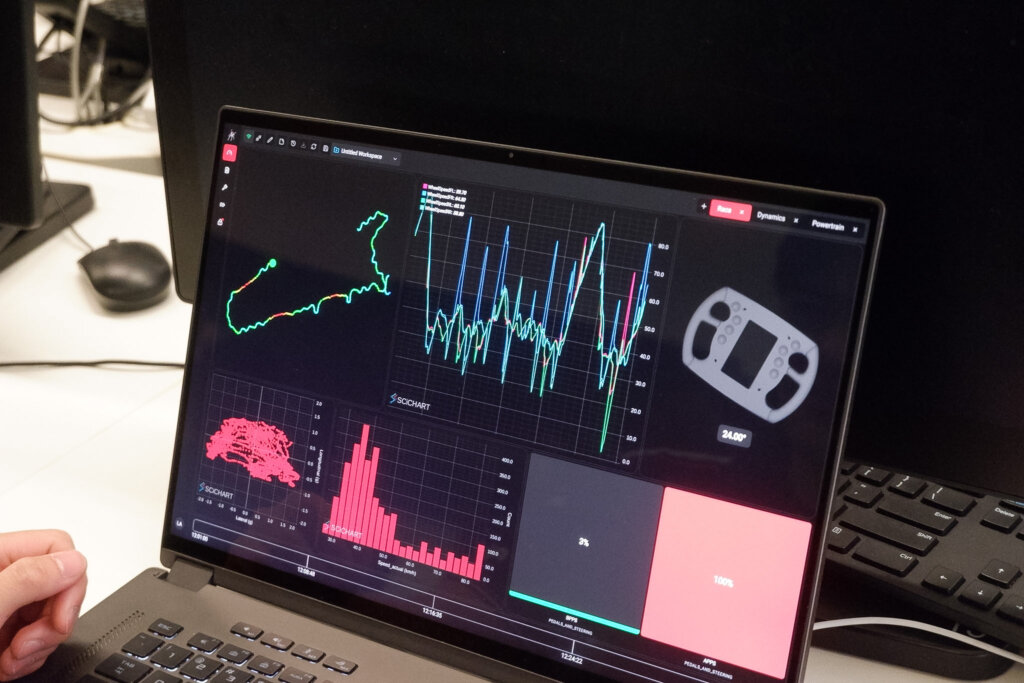
Redback Racing adopted SciChart to improve historical analysis of dense, long-duration datasets.
SciChart provided the features the team already relied on, along with several capabilities they had planned to build themselves, all in a package that was straightforward to integrate.
Real-time updates and interactive pan and zoom are the features Redback Racing uses most heavily. These capabilities are integral to both their live monitoring and historical analysis.
With SciChart, the team combined its separate live and historical chart implementations into a single component. This simplified development and removed the need to maintain two separate solutions.
A Standout Feature: Live Replay Mode
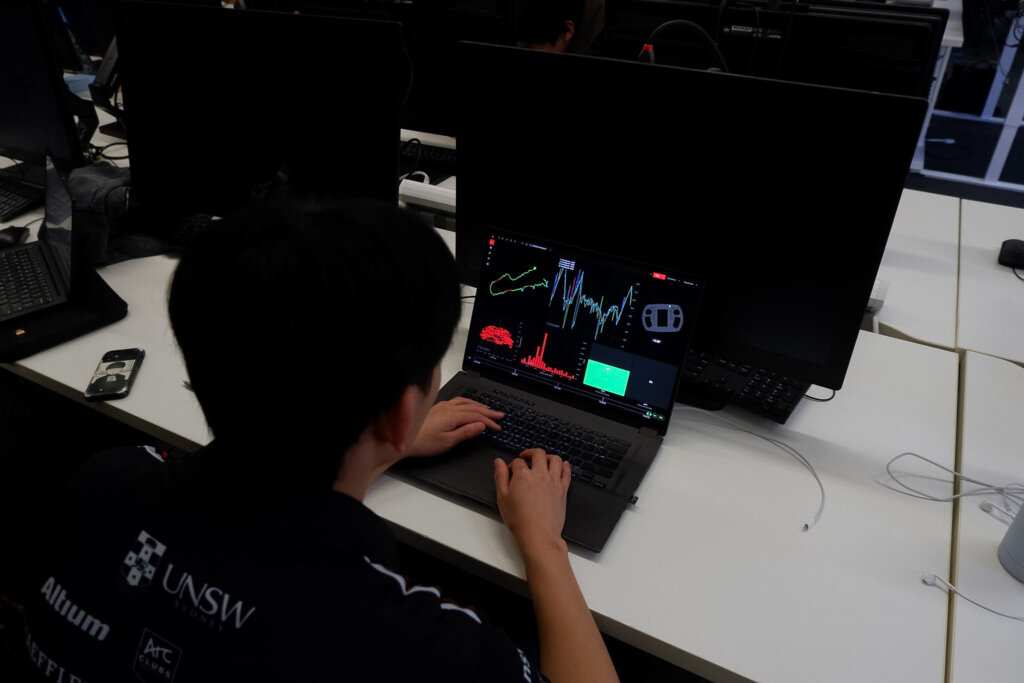
SciChart also enabled Redback Racing to build a live replay mode. Users can jump back to a specific moment in a run to inspect an event more closely, then return straight to live telemetry without interrupting the incoming data stream.
This feature has proven especially useful during testing, when something unexpected happens and the team wants to quickly revisit that part of the run.
“SciChart shifted the bottleneck away from our frontend and back to our streaming architecture and hardware, allowing us to focus on improving the underlying system rather than maintaining charting infrastructure.” Nathan Aaron Isaiah.
The Results: Reliability the Team Can Depend On
Spyder is used heavily throughout test days, so reliability matters as much as performance. Stable charting has reduced interruptions and made the software more dependable during testing.
As a result, the Redback Racing team spends more time focusing on the car and less time worrying about the tooling. Features like live replay have become a key part of the team’s workflow.
Why SciChart?
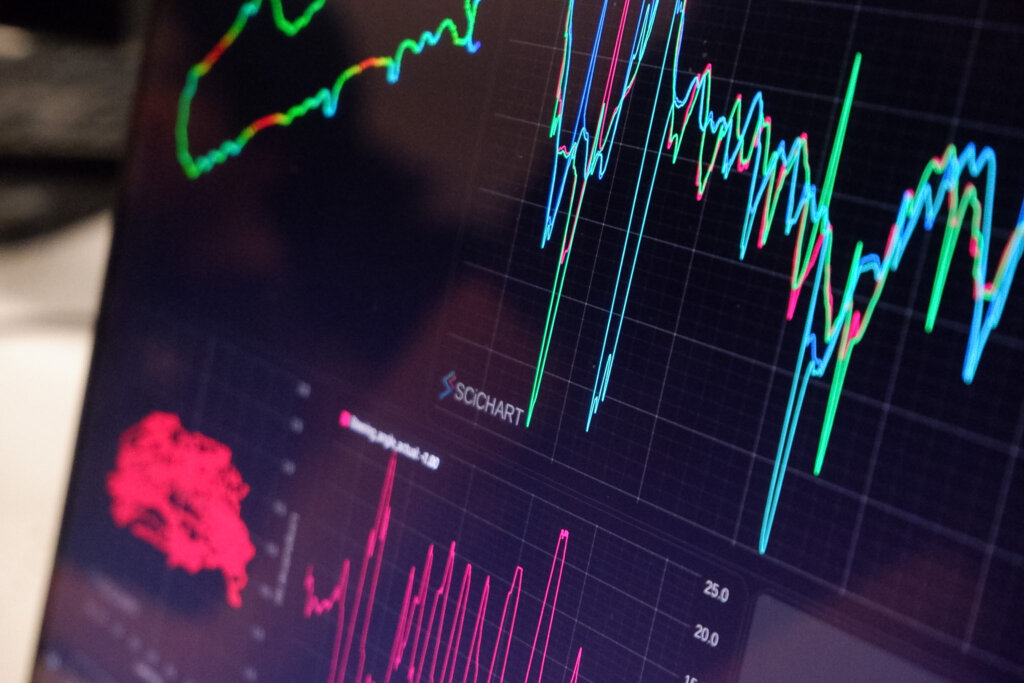
Redback Racing adopted SciChart to address a performance bottleneck in its telemetry stack, and it delivered. Chart performance is no longer something the team has to think about.
This lets the Vehicle Analytics team focus on building new functionality, rather than maintaining its own charting infrastructure.
Using SciChart for Motorsport Telemetry
SciChart is proud to support engineering teams building demanding, real-time data visualization systems, from automotive and motorsport telemetry to medical research. Discover what our cross-platform chart library could do for your data visualization project.
Try our JavaScript and React Charts for free before you commit to a full license. If you get in touch with our team, we can also discuss potential discounts on a commercial-use license to make the same software used by the top F1 teams more accessible.



