Customer: HEIG-VD (School of Engineering and Management Vaud)
Industry: Scientific Research
Platform: SciChart WPF
Hugo Huart, a CS MSE student, approached SciChart for an applied research project at HEIG-VD in Switzerland involving the analysis and visualization of scientific measurement data for an industrial company.
The app is a node-based pipeline for scientific measurement data. A single analysis can generate several different views simultaneously, including:
- Heatmaps
- Scatter plots (including 3D scatter plots)
- Histograms
- Box plots
- Linear profiles
The stock WPF charts they initially tried could not render these in the way that was required for a professional setting. They struggled to combine visualization types, 3D capabilities, and smooth interaction required by the application.
Researchers frequently modify and re-run upstream processing steps. This requires multiple visualizations to refresh together while remaining responsive enough for interactive exploration – a tall order, but with the right software it is more than possible.
Reliable live updates were essentially the end goal, and something many researchers require.
Visualizing Scientific Measurement Data with SciChart WPF
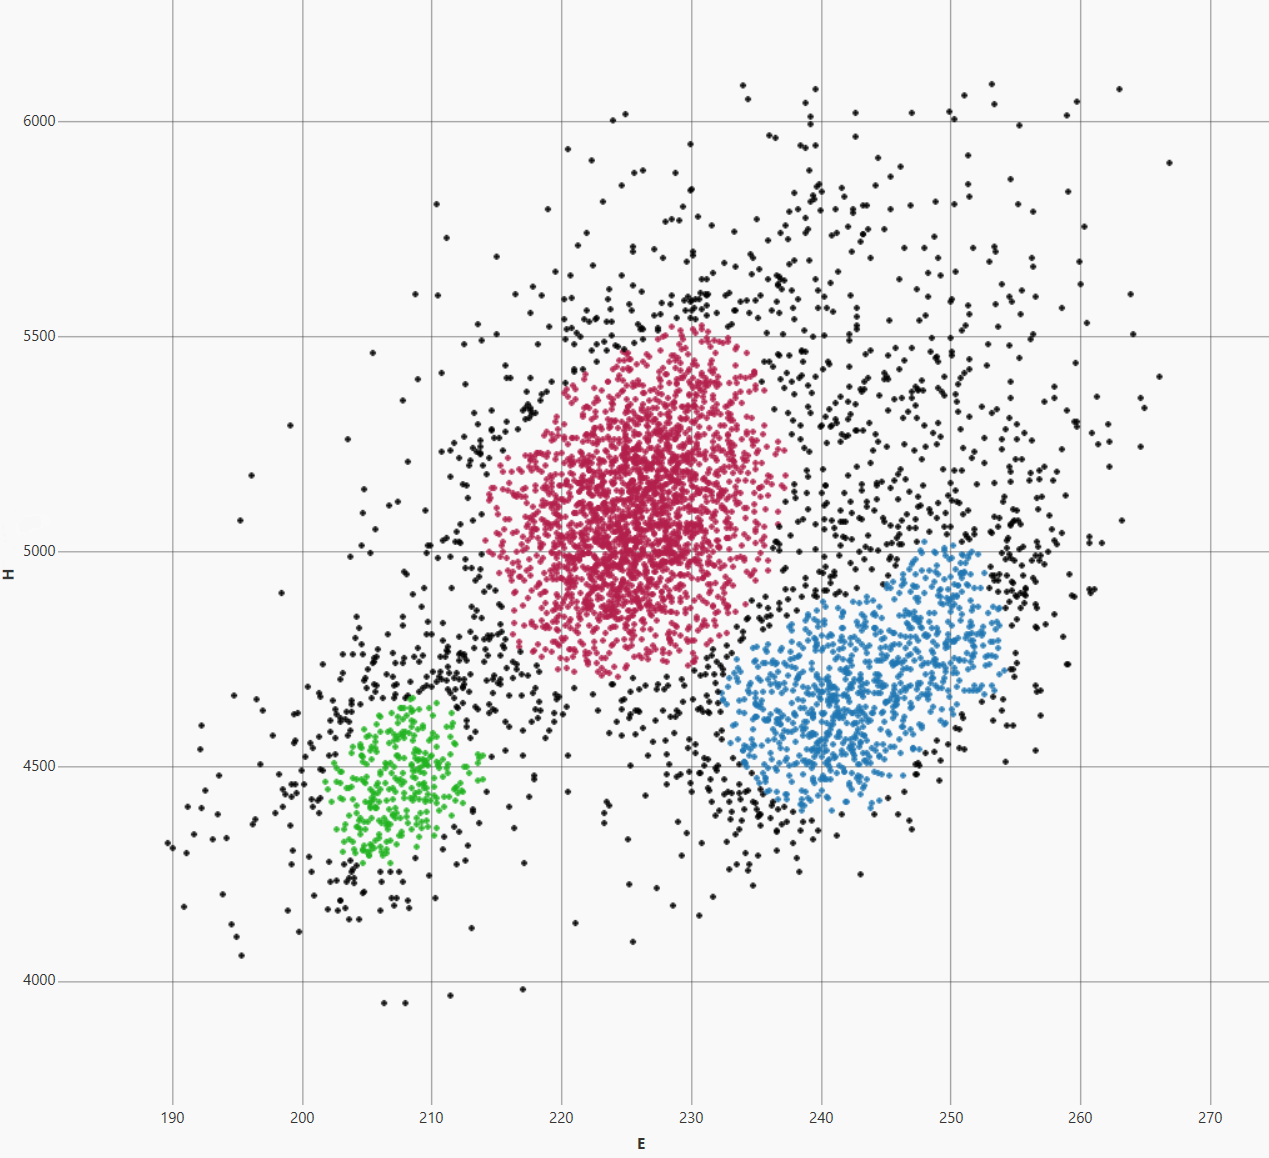
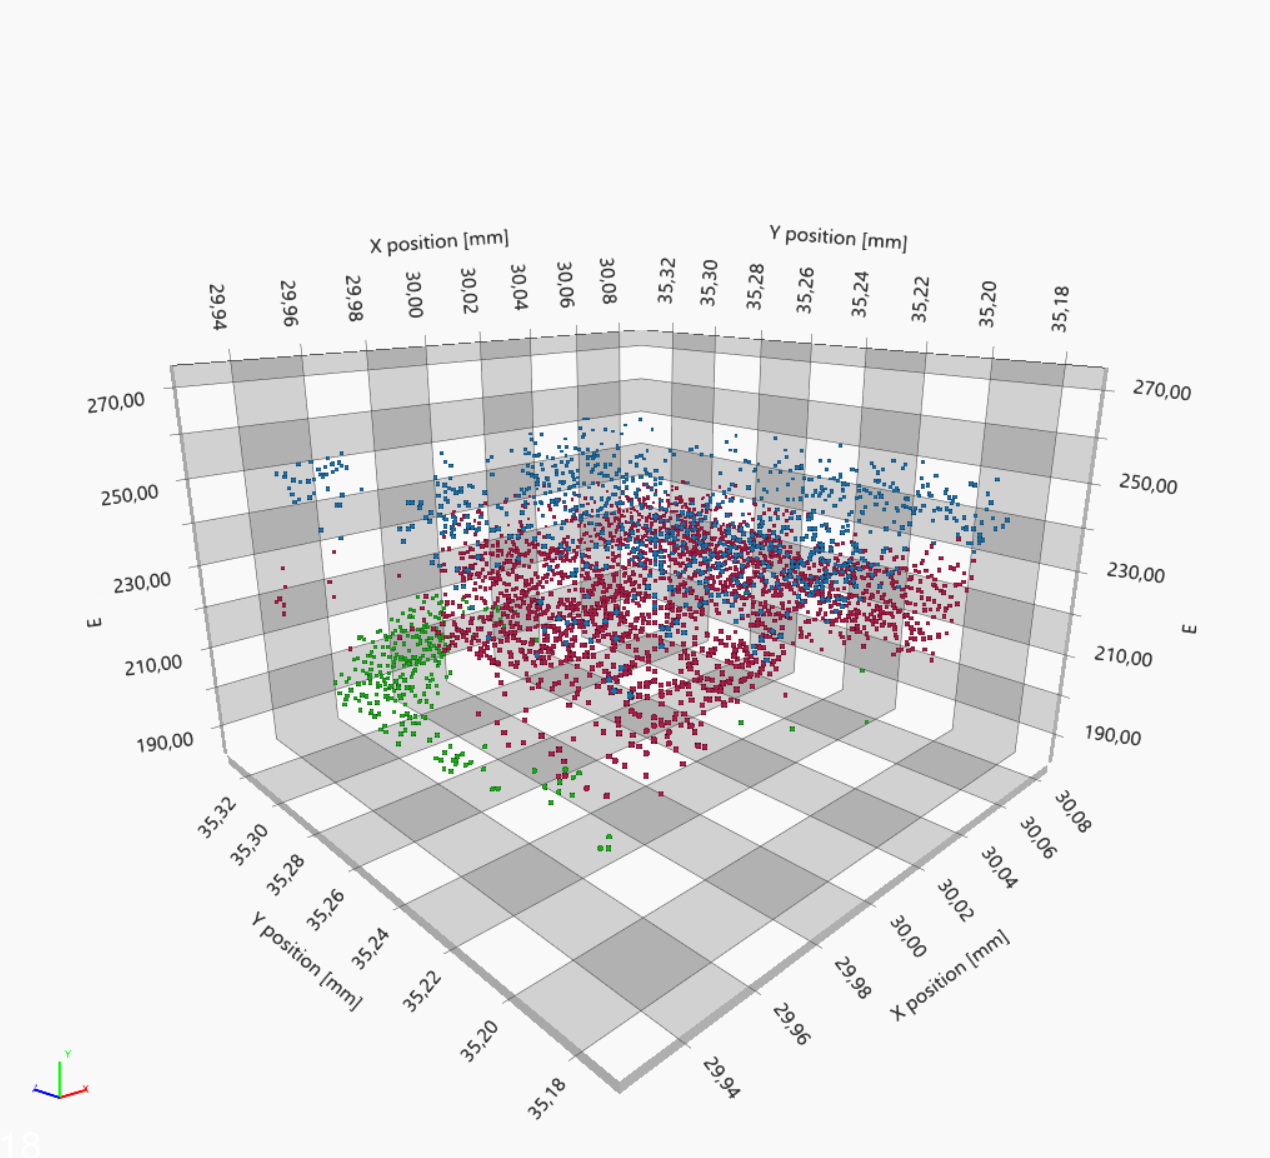
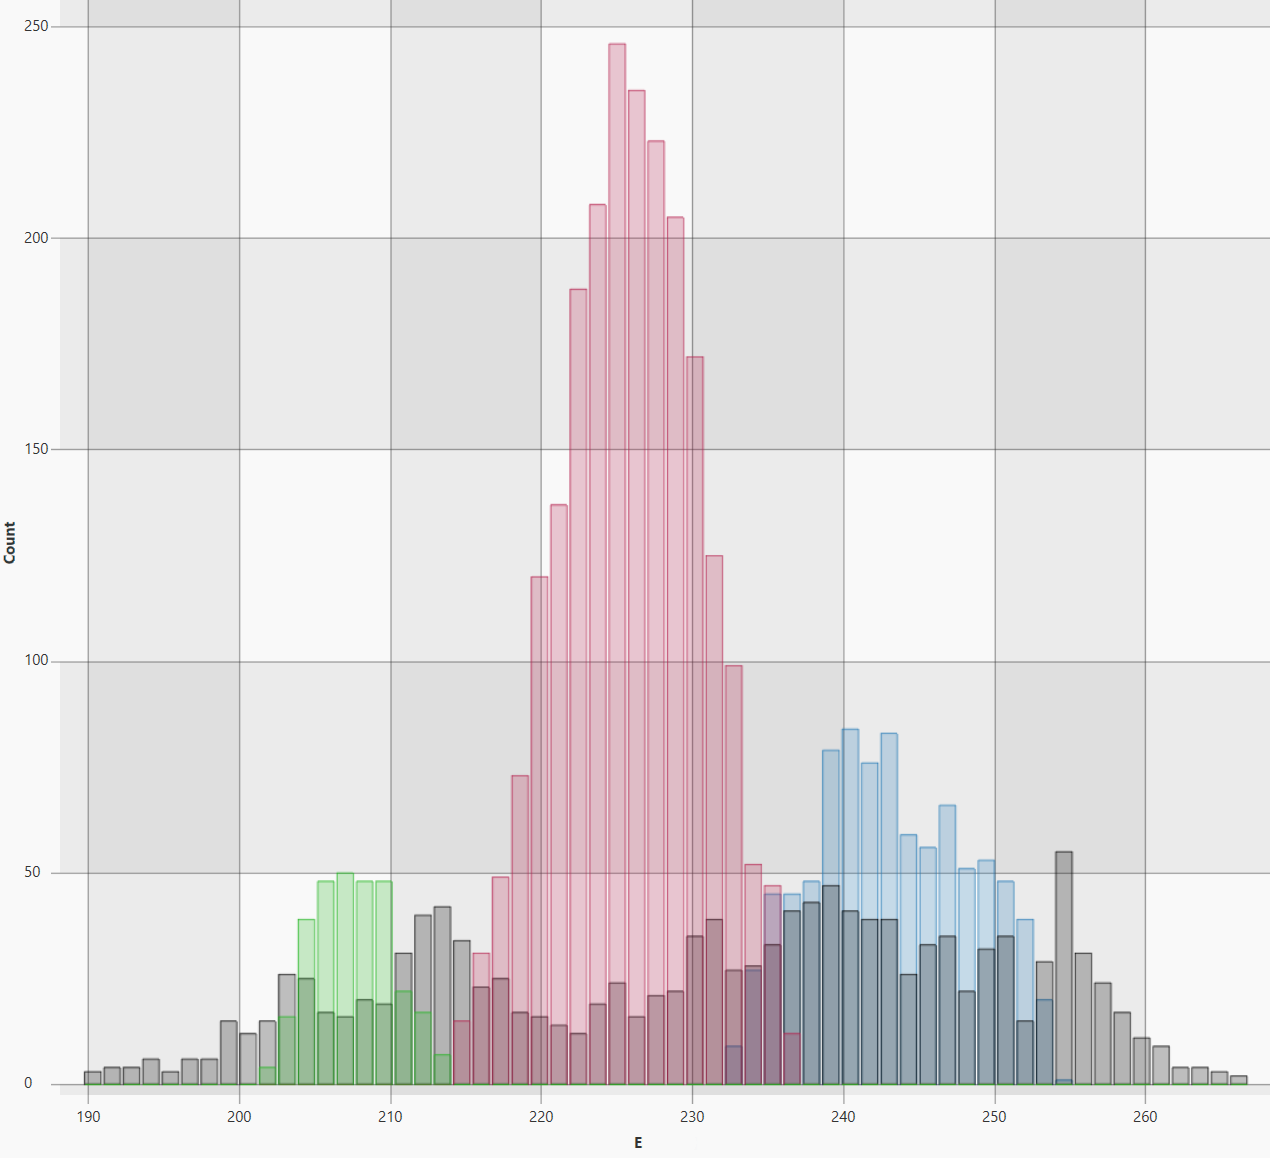
SciChart provided a single API for their visualization needs. Instead of combining different charting technologies, the project could use one API for heatmaps, scatter plots, histograms, profiles, and 3D scientific visualization.
This made it possible to build an analysis workspace where several views of the same measurement data could be displayed and updated side by side.
As researchers re-run stages of the scientific pipeline, the corresponding charts are regenerated while retaining smooth zooming, panning, and data exploration. This was a significant improvement in interactive performance and live re-rendering.
They also overlay images on measurement data with brightness and contrast control. For multidimensional analysis, users can rotate and explore 3D scatter plots to examine clustering and relationships between samples from different perspectives.
“Before SciChart, every re-run of our scientific pipeline exposed the limits of standard WPF charting. Now we can refresh heatmaps, profiles, histograms, and 2D and 3D scatter plots simultaneously while keeping zooming, panning, and exploration fluid. The real breakthrough was getting our entire visual analysis workflow through one high-performance API.” Hugo Huart
The Results: One Visualization Layer for the Scientific Analysis Workflow
- All 2D and 3D views built with one WPF API
- Multiple charts refresh together when the pipeline is re-run
- Zooming, panning and exploration stay smooth during updates
By using SciChart, the project was able to bring its different scientific visualizations into one consistent WPF application rather than relying on separate technologies for 2D and 3D.
For this type of research workflow, the advantage was not just a case of rendering individual charts quickly. Being able to update and interact with several different scientific views as part of the same continuously evolving analysis process was integral.
About SciChart
SciChart is a high-performance charting library for demanding scientific, engineering, and real-time data visualization applications.
Available for WPF, JavaScript, iOS, macOS, Android, Linux, and Avalonia XPF, SciChart helps development teams build interactive visualizations for complex and frequently changing datasets across desktop, web, mobile, and cross-platform applications.
Discover why SciChart is one of the trusted chart libraries for scientific research.
Explore WPF Charts Explore Avalonia XPF