
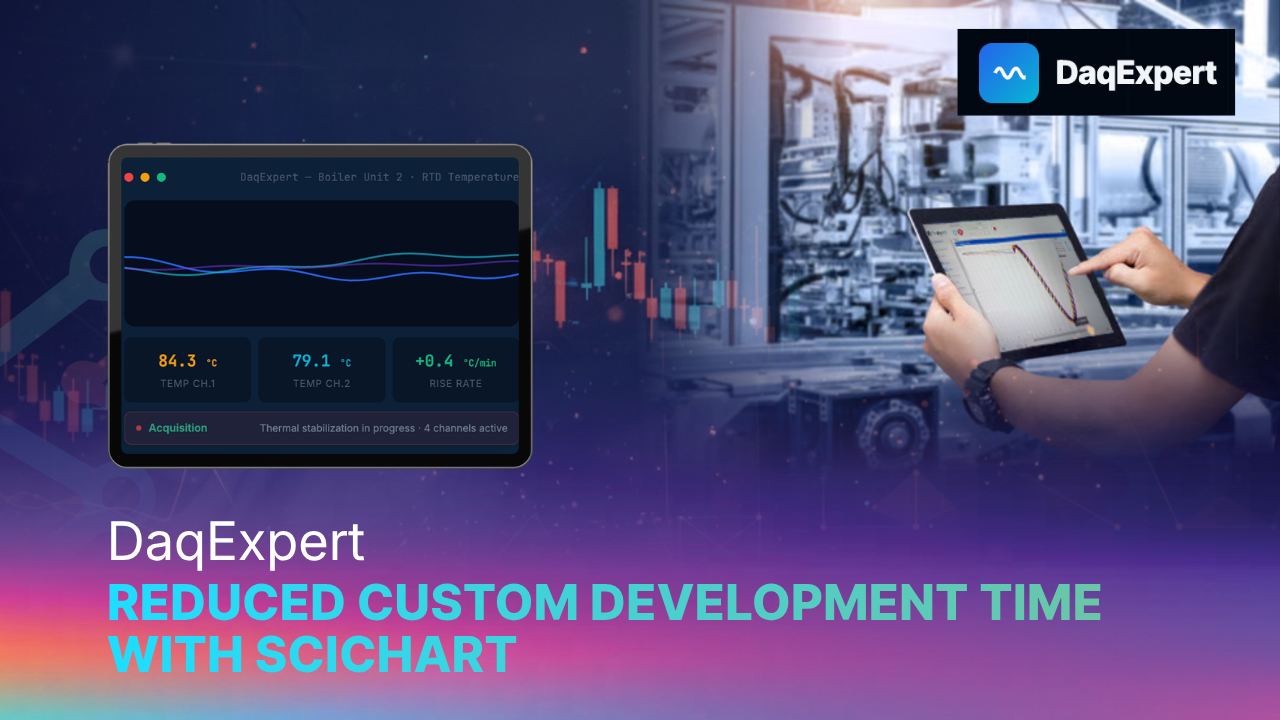
For applications monitoring rotating machinery in the energy, manufacturing, and aerospace sectors, standard WPF charting controls frequently struggle to render high-density vibration channels without freezing.
DaqExpert faced this exact bottleneck while developing a cohesive desktop application tailored for small-to-medium engineering teams. They needed to provide an accessible diagnostic tool that offered real-time performance without lag for intensive workflows.
By implementing SciChart and the Visual Xccelerator™ rendering engine, which supports millions of data points without lag, DaqExpert successfully bypassed months of custom development.
Read the full case study to discover how DaqExpert used SciChart’s customization abilities to deliver specialized, domain-specific visualizations for their users.
What Is DaqExpert?
DaqExpert is an industrial data acquisition and analysis platform built on National Instruments (NI) hardware.
It’s designed to simplify the monitoring and diagnostics of industrial machinery, such as electric motors, hydro-electric turbines, industrial pumps, and compressors, without requiring a specialized data acquisition expert on-site.
The company addresses the full workflow, from real-time signal acquisition to post-processing analysis, in a single cohesive desktop application.
DaqExpert’s modular WPF desktop suite features three integrated applications:
Data Acquisition
Real-time multi-channel signal recording, live chart monitoring with configurable alarms and trend dashboards.
Data Analysis
Post-processing of TDMS recordings with spectrogram (STFT), Campbell diagrams, envelope analysis for bearing fault detection, order tracking, and a high-density data table capable of rendering millions of samples.
Data Reporting
A drag-and-drop report editor that assembles captured charts, statistics tables, checklists, and signature blocks into PDF and DOCX documents.
Who Is DaqExpert’s Application Built For?
DaqExpert’s application is predominantly used for rotating machinery testing in the energy, manufacturing, and aerospace sectors.
Other sectors include R&D test benches in automotive and heavy equipment, specifically to validate component behavior under varying load and speed conditions.
Their main customer base includes small-to-medium engineering teams, and the key pinch point for this market was that they couldn’t justify the high spend on enterprise-grade systems.
DaqExpert wanted to provide a solution for this market, one that was affordable, but that also did the job.
Why Did DaqExpert Need Help from SciChart?
Industrial test engineers working with rotating machinery generate large volumes of multi-channel time-series data.
However, engineers were frequently experiencing the following limitations:
- Generic existing tools that required significant scripting expertise
- Proprietary enterprise systems that didn’t integrate well with custom hardware setups
- Standard WPF charting controls were unable to render vibration channels at 10+ million samples in real time
“SciChart enabled us to render and interact with vibration datasets exceeding 10 million samples in WPF without compromising responsiveness. We used it to build synchronized signal views, Campbell diagrams, measurement cursors, and specialist diagnostic workflows—capabilities that would otherwise have required months of custom graphics development.”
Ernest Tchuisse, Techical Director of TestExpert Energy, the company that developed DaqExpert.
Why Was SciChart the Ideal Solution?
Performance was the primary driver for choosing SciChart as the Visual Xccelerator™ rendering engine could comfortably handle over 10 million data points in real time.
SciChart also provided the flexibility needed for domain-specific visualizations:
- Campbell diagrams (2D heatmap with overlaid order lines)
- Dual-cursor interaction for ΔT measurement
- Synchronized multi-panel layouts
To achieve the same results without SciChart would have required months of custom development.
What Was the Outcome?
DaqExpert now offers an affordable and reliable diagnostic solution for machine testing engineers.
Modules, such as a chart captured in data analysis, can be sent directly into a report block in data reporting with one click. This eliminates the manual copy-paste workflow.
The application can also be used offline and on-site with no cloud dependency.
Every facet of the solution is geared towards efficiency and reliability. To see how SciChart could help you achieve similar results, sign up today.



