
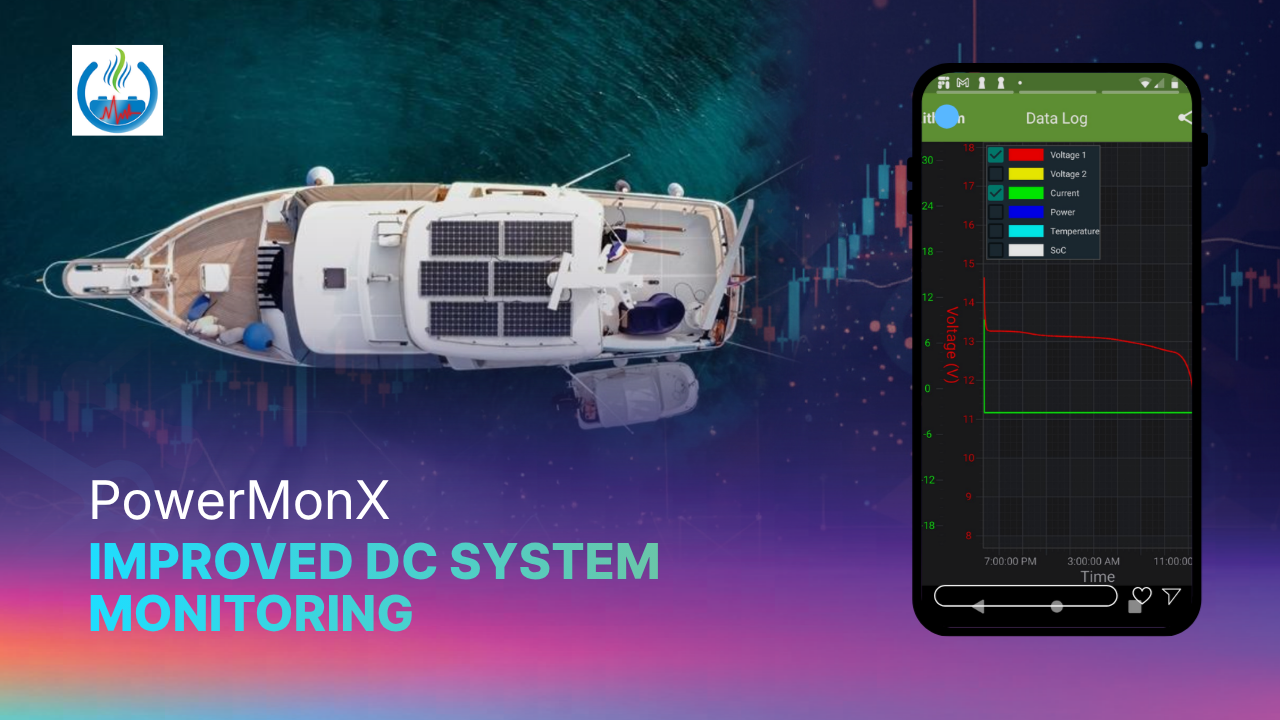
Application: PowerMonX (iOS & Android)
Company: Thornwave Labs Inc.
PowerMonX by Thornwave Labs is a free app designed to seamlessly interface with PowerMon advanced Bluetooth and Wi-Fi battery monitors and DC power meters.
Ideal for RVs, boats, and solar installations, the app allows users to remotely scan, configure, and monitor real-time electrical data, such as:
- Voltage
- Current
- Power
- Temperature
- Battery state of charge
PowerMonX gives users full control over their DC systems by allowing them to view up to three years of onboard data logs, manage timers, protect hardware via custom alerts, and manually or automatically switch connected power relays on and off.
Who Is the PowerMonX Application Designed For?
Most users are RV / boat owners. There is an entire community of owners that are adding solar panels and large batteries that allow them to be off-grid for extended amounts of time. Users want to be self-sufficient when it comes to energy.
It’s important to have a fuel gauge available to know how much energy is left in the batteries. Data logging and the data charting is a bonus for them. This allows them to also analyze and understand how their batteries are working.
Other users belong to long-haul trucking. Solar and batteries allow the cab to have heating / AC without keeping the engine on for 10 hours at a time during the night at rest places.
Some customers use it in remote cabins in the mountains where the power grid is not available and, again, they depend on the power they can produce themselves – whether that’s solar, wind, or hydro.
What Were the Technical Requirements for this Project?
A defining technical requirement was the ability to handle very large datasets. In real-world usage, the app routinely displays over 1 million data points across 5 concurrent channels. This creates a non-trivial rendering and memory management challenge, particularly on mobile devices.
SciChart’s high-performance rendering engine, combined with its efficient data series structures, enables PowerMonX to manage this scale without degrading interactivity or frame rate.
The PowerMon can be configured to sample from once a second to once a minute. This gives it a total storage capacity of 18 days (for 1-second sample time), up to about 3 years of data (for 1-minute sample time).
Implementation (Android)
On Android, PowerMonX uses SciChart with Kotlin and integrates it into a modern UI stack.
- Time-series data is stored in XyDataSeries with timestamp-based X values.
- Missing or invalid samples are explicitly represented using NaN, allowing SciChart to render discontinuities correctly without additional logic.
- Batch appends and careful range management are used to avoid unnecessary redraw overhead.
- Data needed to update from once a second to once a minute (configurable)
- SciChart handles the data on its own. The data downloaded from the device is kept locally on the mobile device.
Cross-Platform (iOS)
On iOS, SciChart provides equivalent functionality, ensuring consistent behavior and visual fidelity across platforms. Users can smoothly zoom, pan, and inspect dense datasets, even when navigating long historical logs. Multi-axis support allows different units (e.g., volts, amps, watts) to be displayed simultaneously without ambiguity.
How Does PowerMonX Use SciChart?
PowerMonX integrates the SciChart library to deliver high-performance visualization of battery telemetry on both iOS and Android platforms.
The application renders multiple time-series signals, including voltage, current, power, temperature, and state of charge. All this is captured from PowerMon devices.
Why Was SciChart the Ideal Solution?
SciChart was selected over simpler charting libraries due to its ability to sustain interactive performance under heavy data loads. Its architecture is well-suited for embedded telemetry use cases, where high-resolution logging and multi-channel visualization are essential.
The main limitations of previous tools included a lack of speed and an inability to sufficiently handle 1 million data points or more.
“We evaluated free charting alternatives, but they simply couldn’t handle the volume of data we needed to display. I even developed my own OpenGL-based graphing library and managed to get close to SciChart’s performance, but achieving that level of speed and optimization takes significant development time. SciChart gave us the performance we needed out of the box, allowing us to focus on building PowerMonX rather than building and maintaining our own charting engine.”
Razvan Turiac, Founder & CEO at Thornwave Labs Inc.
What Was the Result?
The result is a responsive and scalable charting system that transforms large volumes of raw PowerMon data into actionable insights, without compromising usability, even at a million-point scale.
Users get to visualize and analyze the voltage / current data. This can come from a solar system, where they can analyze the power produced by solar panels, or they can diagnose the performance of the system or batteries.
Achieve Similar Results with Support from SciChart
For iOS and Android application developers facing rendering bottlenecks with standard charting widgets or suboptimal web-views that drain battery life, exploring native hardware acceleration can significantly improve application responsiveness.
SciChart offers dedicated native chart libraries for Swift, Objective-C, Java, and Kotlin, leveraging Metal for iOS and OpenGL for Android to deliver direct hardware-accelerated rendering.
By using the proprietary C++ Visual Xccelerator™ engine across all devices, developers can maintain a consistent application programming interface and feature set across cross-platform teams.



