Platform: WPF
Industry: Research, Robotics
RoboCup is an international scientific initiative with the goal to advance the state of the art of intelligent robots. The original mission established in 1997 was to field a team of robots capable of winning against humans in the football (soccer) World Cup championship by 2050.
The original scope has now been updated to cover several leagues, including soccer, search and rescue, and industrial. With advances in technologies and their applications in the modern world, the inclusion of new leagues has added in life-saving applications and efficiency-increasing measures for the commercial sector.
Effective data visualization is crucial for monitoring robot performance, analyzing strategies, and making real-time decisions.
This case study explores how the SciChart library was utilized to enhance data visualization capabilities in the RoboCup 2022 competition across design, test and emulation.
RoboCup 2022 Project Objectives
Real-time monitoring was a critical requirement, enabling teams to visualize live data streams from multiple robots, including performance metrics such as speed, sensor readings, and positional data. These metrics were essential for real-time decision-making, optimizing scoring strategies, and defensive coordination during competition. Additionally, post-competition data analysis was a key objective, focusing on evaluating team strategies, assessing robot performance efficiency, and identifying actionable areas for improvement.
The project scope extended beyond data rendering. A core objective was to develop a user-friendly, intuitive dashboard that allowed team members to interact with complex datasets seamlessly, minimizing the need for technical expertise while maximizing accessibility and efficiency in data interpretation.
The System: What Does it Take for Autonomous Robots to Win Soccer?
Autonomous soccer-playing robots require a highly advanced and integrated system architecture capable of executing real-time decisions with precision and efficiency. These systems are designed to emulate biological processes through a bio-inspired electronics architecture, enabling coordinated and adaptive responses in competitive environments.
Core Components of the System:
- Central Processing Unit (The “Brain”): An embedded computer, powered by the advanced LattePanda SIGMA, serves as the robot’s “brain”. This executes intelligent strategies and processes complex tasks.
- Perception System (The “Eyes”): Advanced sensors and four intelligent cameras (JeVois Pro with AI Hailo 8 processors) deliver high-bandwidth data, enabling the robot to see and react in real time.
- Sensor and Actuator Network (The “Nervous System”): A sensor and actuator controller acts as the robot’s nervous system, managing high-frequency tasks and syncing with over 20 peripherals to deliver seamless performance.
- Real-Time Decision Making: Real-time image segmentation uses deep learning to perform immediate AI-driven decisions, enabling split-second thinking. The digital twin simulator also supports independent decision-making and enhances strategic coordination.
Real-time Integration for Performance Optimization
Victory at RoboCup hinges on more than advanced robotics—it requires seamless system integration, real-time data acquisition, and actionable insights to drive performance.
Key strategies deployed by RoboCup teams included:
System Integration with Robotics:
Robots were equipped with high-precision sensors, including LIDAR, cameras, and gyroscopes, generating continuous streams of critical match data.
High-Speed Data Transmission:
Real-time data was relayed to a central server using fast and reliable wireless protocols, supplemented by SPI, CAN, and UART wired connections for low-latency and precision.
Advanced Visualization with SciChart:
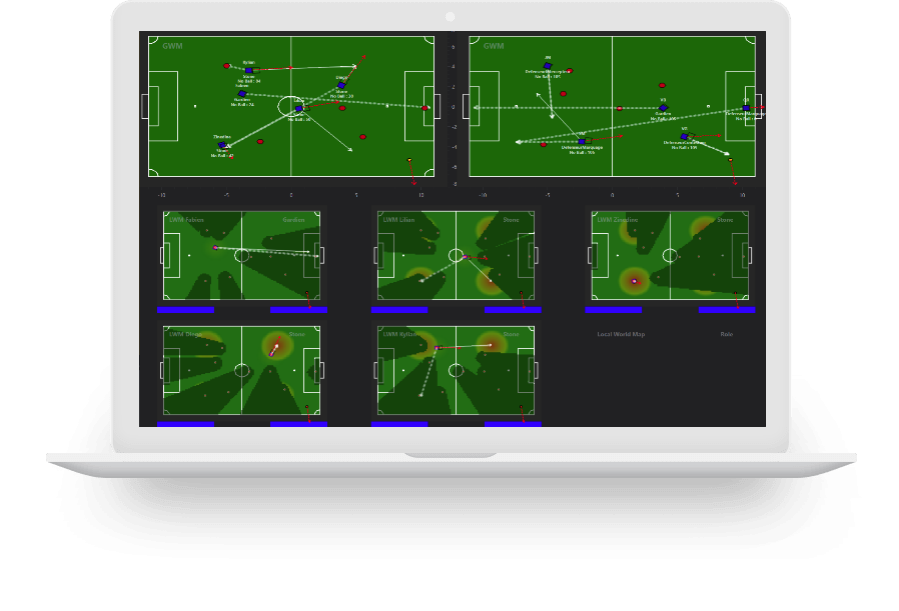
SciChart enabled high-performance visualization of real-time sensor data, such as speed, distance, and obstacle detection. Its capacity to process billions of data points ensured seamless handling of simultaneous data streams across multiple robots.
Custom dashboards were developed using SciChart’s flexible APIs, integrating interactive features like color-coded indicators, zooming, tooltips, and dynamic filtering. This allowed team members to analyze key metrics and make split-second decisions during matches.
Competitive Insights Through Visualization
Enhanced Decision-Making with SLAM Strategies:
Teams adopted Simultaneous Localization and Mapping (SLAM) strategies, fusing AI camera and 2D LIDAR data for real-time environmental mapping. This integration enabled precise obstacle detection and dynamic adjustments during competition.
About:SciChart LIDAR data example showing a 1km x 1km slice of London with overlaid heatmap for height, ability to zoom and move seamlessly through data plus dynamic data solidity toggle on WPF.
Post-Match Analytics:
SciChart facilitated in-depth analysis of robot performance, uncovering behavioral patterns and correlations that were previously obscured.
Proven Results:
Teams using SciChart secured 1st and 2nd place in scientific and technical challenges. The clarity and usability of the dashboards directly contributed to improved strategy execution and coordination.
SciChart’s Impact on RoboCup Success
SciChart’s high-performance charting framework played a pivotal role in the RoboCup 2022 visualization project, enabling teams to monitor, analyze, and respond to robot performance data in real-time. Its robust tools and customizable features empowered teams to streamline decision-making and improve strategic planning.
This is not the first success story. SciChart was previously employed by Robot Club Toulon, delivering exceptional results in real-time telemetry visualization for robotics competitions.
Future Directions in Robotics and Visualization
The future of robotics will see further advancements in predictive analytics, scenario simulations, and immersive data visualizations, such as virtual reality. SciChart remains committed to pushing the boundaries of large-scale data visualization to support these innovations and unlock the full potential of competitive robotics.
