Platform: JavaScript
Customer: Institute of Plasma Physics, Hefei Institute of Physical Science in China.
Industry: Nuclear Fusion Technology
SciChart’s chart library was chosen to power the next generation of nuclear fusion research at the Institute of Plasma Physics, Hefei Institute of Physical Science in China. In particular, they needed support for their experimental superconductor evaluation platform—crucial for future fusion reactors.
About the Institute of Plasma Physics
Founded in September 1978, the Institute of Plasma Physics (IPP) focuses on the peaceful use of fusion energy. It’s a key laboratory for magnetically confined fusion in China and part of the World Laboratory’s Nuclear Fusion Research Centre.
IPP has received numerous accolades, including a special National Science and Technology Progress prize, multiple CAS Science and Technology progress prizes, and CAS Natural Science prizes.
Actively fostering international cooperation, IPP engages in personnel and equipment exchanges with the EU, USA, Japan, Russia, India, and Australia, and attracts many visitors, including industrialists, academics, and politicians.
What Research Are They Doing?
With over 400 staff (223 scientists/engineers) across 12 divisions, 2 technical centers, and 4 high-tech companies, IPP’s research spans high-temperature plasma physics, magnetically confined plasma physics, and reactor studies.
Technical studies include high-power power supply, high field magnets, microwaves, vacuum, cryogenics, and data acquisition. Important divisions also include ion beam bio-engineering and electrophysical apparatus design.
IPP operates two controlled fusion devices: HT-7 (China’s first superconducting tokamak) and EAST (the world’s first non-circular cross-section full superconducting tokamak). Auxiliary systems include RF and Lower Hybrid Wave heating systems, a pulsed motor generator, and China’s largest liquid helium cryogenic system. IPP also possesses a 20-Tesla hybrid magnet, superconducting magnet manufacturing/testing facilities, and China’s first single-particle microbeam facility.
What’s the Process?
China’s Super-X device enables real-time, accurate and reliable acquisition and analysis of complex data from numerous engineering and experimental sensors.
Key Stages Include:
- Acquisition > Capturing data from over 800 channels, including temperature, pressure, current, and quench voltages.
- Filtering > Reducing noise to preserve signal integrity and ensure data accuracy.
- Transmission > Leveraging ZeroMQ middleware with a multi-threaded pub/sub model for high-speed, lossless data transfer.
- Storage > Combining Elasticsearch for fast, short-term queries with PostgreSQL for long-term, scalable data archival.
- Visualization > Real-time display via SciChart, supporting continuous monitoring and rapid diagnostics.
- Analysis > Interpreting processed signals to evaluate superconducting performance and inform experimental design through customized interfaces.
What Challenges Did the Institute Need to Overcome?
Due to their custom requirements and intense performance and accuracy needs, signal processing faces significant challenges in data visualization.
Below is a summary of the issues faced by the fusion research team:
- Managing high-speed, high-volume data without loss or latency is critical but technically challenging. Super-X handles over 800 distinct signals, many sampled at high frequencies.
- Differentiating useful signals from noise requires precision. Signals vary widely, from slowly evolving engineering data, such as temperature, to rapid changes, such as quench detection voltages.
- Customizable setups to accommodate evolving experiments, especially in superconducting conductor research, complicates system design and data processing.
- Immediate visualization of data for live decision-making during experiments.
- Efficiently handling short-term and long-term data storage while maintaining accessibility for analysis.
Fuelling Nuclear Fusion’s Full Potential with SciChart:
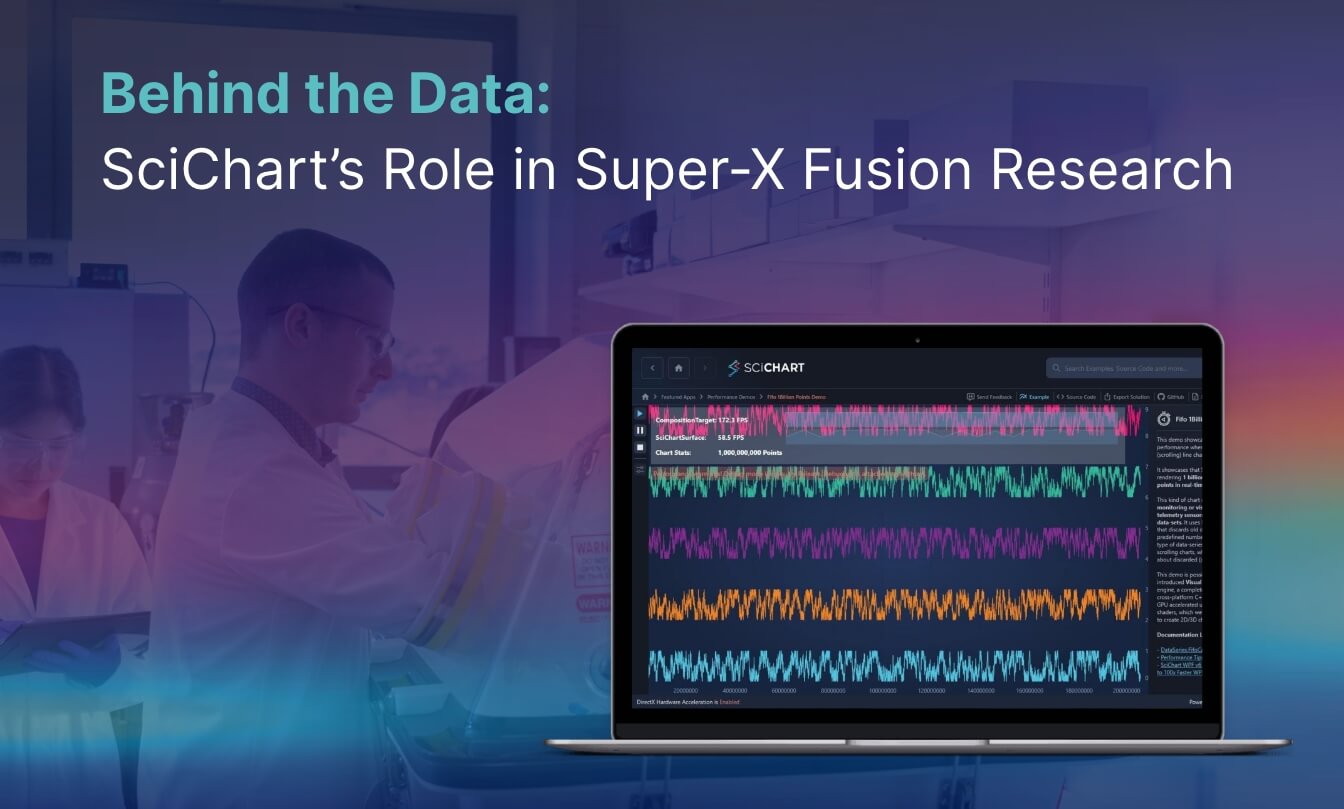
The Institute of Plasma Physics selected SciChart.js for their real-time charting needs as part of the Super-X system, based on publicly available documentation. SciChart’s high-performance chart library enabled advanced signal processing and real-time data visualization for the Super-X device.
Handling high-frequency data, the 64-bit data rendering engine provided precise design, emulation, and testing of superconducting components. Meanwhile the flexible APIs and dashboards ensured seamless integration, reliable analysis, and reduced data loss.
While we were not directly involved in the development or integration, SciChart’s adoption in such a high-stakes environment speaks to its performance, flexibility, and reliability under pressure.
- Real-time, high-speed rendering of complex datasets without compromising accuracy.
- Customizable visualizations for diverse signal types and experimental setups, providing seamless integration with Super-X’s systems.
- Advanced algorithms ensure noise is reliably filtered for clean, precise signal representation, crucial for analyzing superconducting performance.
- Dynamic scaling to meet the demands of high-volume, high-frequency data acquisition without lag or loss across platforms and devices.
- Optimized data rendering pipelines ensure rapid visualization of historical data while supporting real-time display.
Why Choose SciChart?
By optimizing performance and accelerating testing, SciChart drives innovation in superconducting magnet design—paving the way for fusion energy advancements.
We’re trusted by Fortune 500 companies and Government agencies globally and deployed across our NATO allies.
What Do We Offer?
- Unrivaled Flexibility: SciChart excels where open-source or off-the-shelf options fail, handling complex charting needs for pioneering technology and energy-sector research.
- Accelerated Deployment: Benefit from extensive documentation, examples, an active community, and top-rated support, all designed to reduce your deployment time.
- Guaranteed Performance & Reliability: With a GPU-accelerated graphics engine, SciChart ensures data stability, reliability, and high performance across all devices. SciChart is capable of rendering millions of data points in real time at 60 FPS.
- Long-term Dependability: A sustainable business model guarantees product continuity, making SciChart a reliable choice for critical national scientific testing, design and research applications.
About SciChart
SciChart is a high-performance JavaScript, WPF, iOS, Android and Avalonia XPF chart library used to visualize pioneering data insights.
SciChart supports the rendering of complex, interactive, real-time charts with many millions of data points for demanding scientific, medical and financial applications and embedded systems that require high performance, rich interaction and smooth updates.
Explore the pioneering design, test and emulation projects we’re supporting for future-thinking research and development.
For more information about how we can support your mission-critical data visualization projects, contact us today or visit our JavaScript chart library page.
