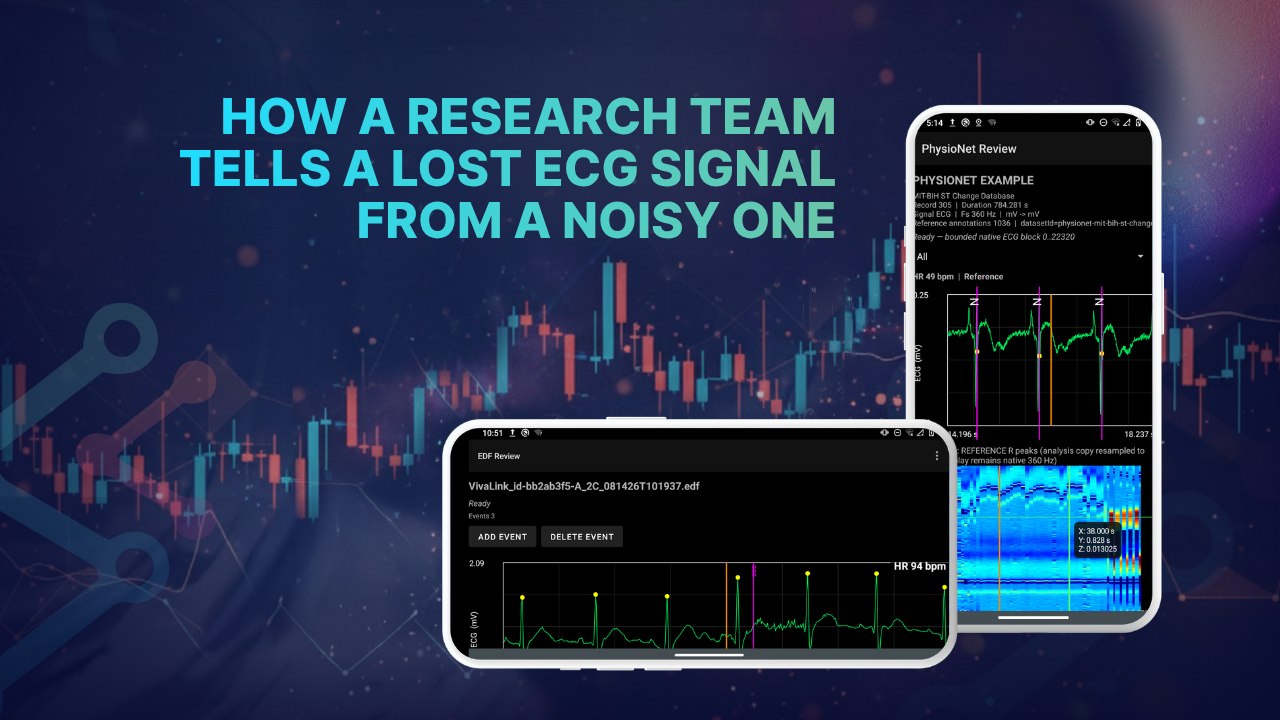
Customer: Research team at Shenzhen University of Advanced Technology
Industry: Wearable physiological monitoring and digital health research
Platform: SciChart Android
A wearable sensor streams a participant’s ECG to an Android device over Bluetooth. It sends 128 samples every second, for hours at a time.
Sometimes the waveform on screen turns ragged. Sometimes the data stops arriving altogether. Both look like a recording problem, but they are not the same problem.
A research team at Shenzhen University of Advanced Technology needed to tell them apart. Its SciChart Android charts made that possible.
Here’s how the team built live ECG monitoring on one chart engine.
Meet the Research Team
The team is a small interdisciplinary research group at Shenzhen University of Advanced Technology in China. It works on wearable physiological monitoring and digital health applications.
Its members bring together software engineering, biomedical signal processing, clinical collaboration, and medical-device development. Current work centers on ECG monitoring and electrophysiological analysis. The team is also building tools for longer-term and, eventually, remote monitoring.
Gaoyuan Zhou works on the software and system side. That covers Android development, wearable-device integration, ECG signal processing, and visualization. It also includes data recording and the technical architecture for future remote monitoring.
What Does the ECG Monitoring App Do?
The team developed an Android app for ECG and ECM monitoring with wearable sensors. It was first built around the VivaLink VV330 sensor. The app:
- Receives continuous ECG data over Bluetooth.
- Displays the ECG waveform live.
- Detects R-peaks and calculates heart-rate measures.
- Computes ECM results.
- Records the signal in EDF format.
A Review Mode lets users reopen and examine historical recordings.
The app started life as a research prototype. The team has been turning it into a fuller monitoring workflow. That meant improving the UI and separating acquisition logic from analysis logic. It also meant adding Review Mode, long-duration recording, and better failure diagnostics.
Today, the research and development team uses the app for real-device ECG acquisition and signal-processing experiments. It also uses it to validate the monitoring workflow. The app is currently undergoing real-device and long-duration validation.
The team is building it with future clinical and remote-monitoring workflows in mind. In that setting, a clinician or researcher could review recorded ECG and ECM data.
Four Charts Across Live and Review Modes
Real-Time ECG Waveform
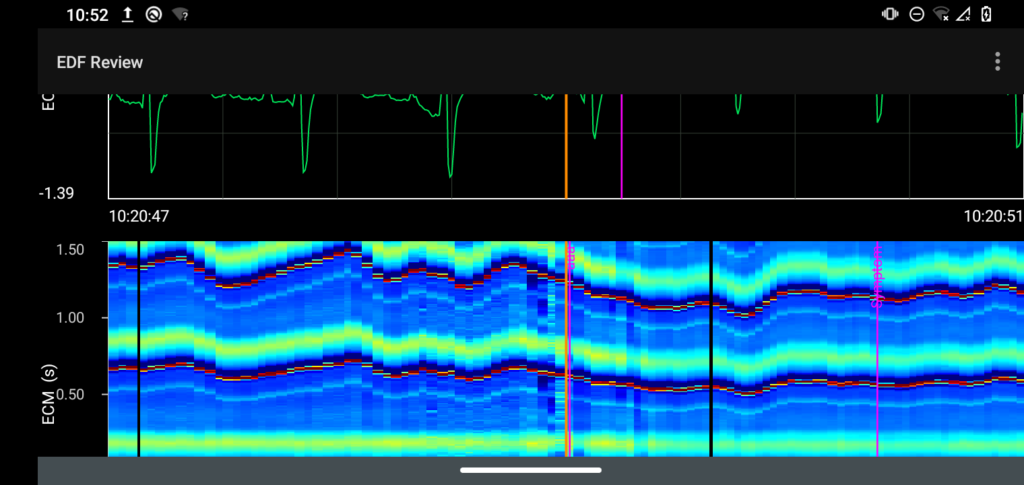
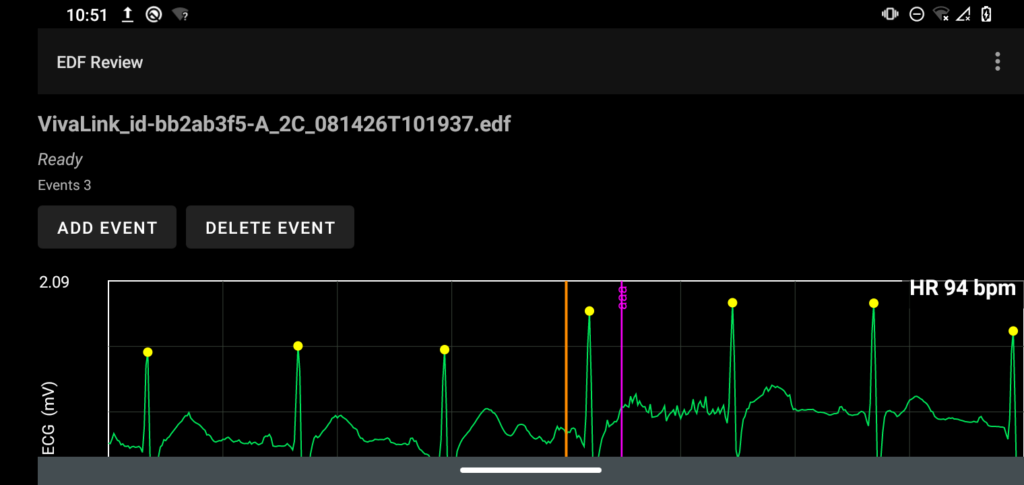
A line chart shows the incoming ECG as it arrives. The VivaLink workflow runs at 128 samples per second. The chart has to update continuously. Users still need to inspect waveform morphology and signal quality as it does. The benefits of efficient rendering of waveforms include no memory leaks, the ability to scroll through historic data, and the ability to add a high volume of annotations on top.
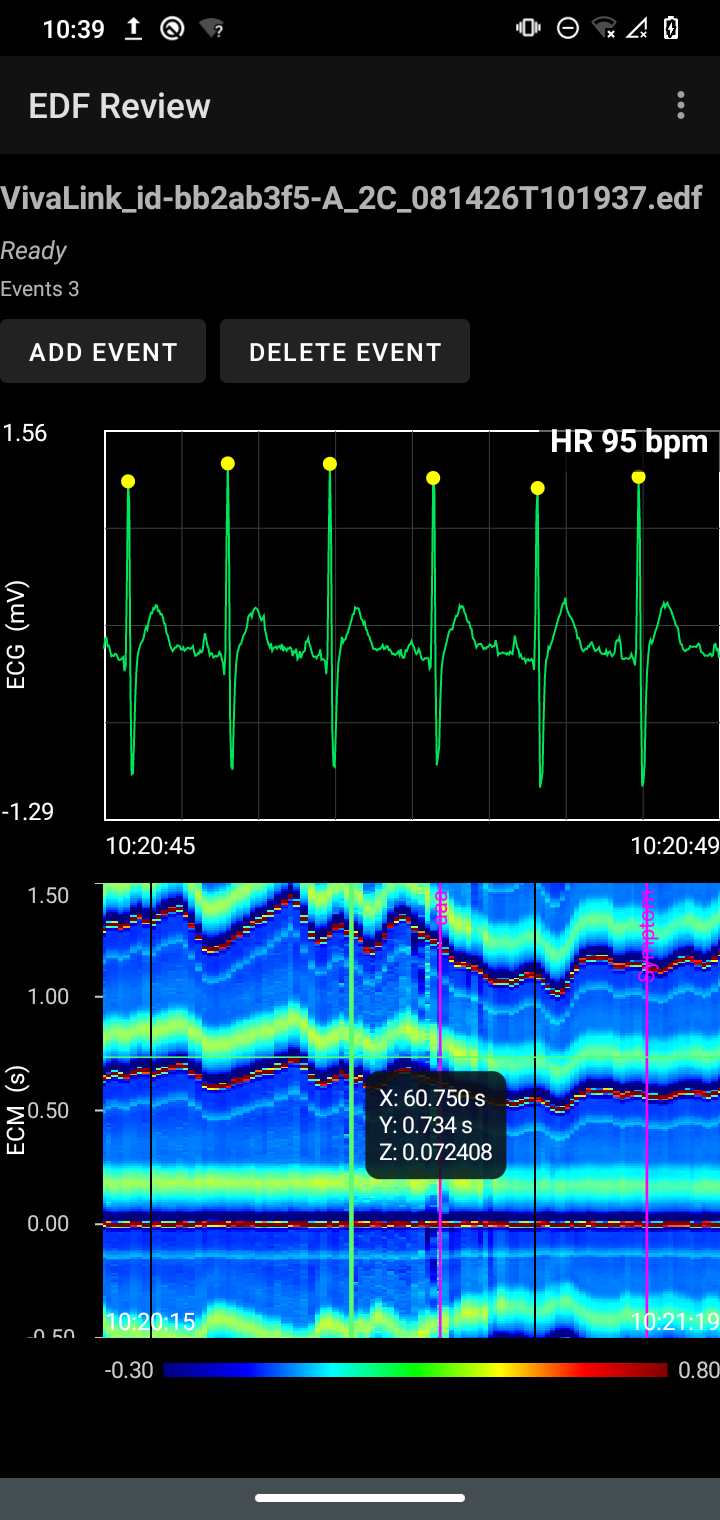
Real-Time ECM Heatmap
A heatmap shows ECM results over time. Each new result extends the time axis. Users can watch the derived physiological pattern change during a recording. View the Android Heatmap example.
Review ECG Chart
Users reopen recorded EDF files in Review Mode. They can move through the ECG, inspect different time ranges, and view annotations or events. View the Android ECG example.
Review ECM Heatmap
The matching ECM results are available in Review Mode too. Users can compare the ECM pattern with the underlying ECG and events across the same period.
Why Is Physiological Data Hard to Chart?
Continuous physiological monitoring puts several demands on a chart at once.
The app handles a continuous 128 Hz ECG stream from the sensor. In parallel, it runs R-peak detection, heart-rate analysis, ECM calculation, EDF recording, and chart updates.
In the main monitoring view, the ECG and ECM charts sit together. They have to stay synchronized in time.
Recordings can run for several hours. The team has to control memory growth and stop chart history from growing without limit.
Wearable data is rarely clean, either. Bluetooth drops, missing packets, sensor movement, and electrode-contact changes all happen. The app has to tell a poor-quality signal from a true break in the data stream.
Live and review modes also pull in different directions. The live display needs low latency. Review Mode needs smooth movement backward and forward through long recordings.
Why General-Purpose Chart Libraries Fell Short
The early prototype used a more limited visualization approach. The team also looked at general-purpose Android chart libraries. A third option was writing more of the rendering itself.
None of these fit the job. The app needs continuous waveform updates, heatmaps, and precise time axes. It also needs zooming, navigation, annotations, and interaction with relatively large datasets.
“Physiological monitoring is quite different from displaying a static business chart.”
Gaoyuan Zhou, Shenzhen University of Advanced Technology
Custom rendering would have meant building and maintaining graphics infrastructure in-house.
Many general-purpose mobile libraries are designed mainly for conventional static charts. They are not built for continuously updating scientific signals.
Why the Team Chose SciChart Android
The team chose SciChart because it is designed for high-performance, real-time scientific data visualization.
Fast line series rendering, heatmaps, and configurable axes were all in one framework. So were zooming, panning, and interactions. Together, they suited ECG and ECM visualization far better than the alternatives.
One advantage stood out. The same framework could handle the continuously updating ECG waveform and the more specialized ECM heatmap.
The charting API got the first ECG view working relatively quickly. Later work focused on synchronizing the ECG and ECM views. It also covered managing long-duration data and supporting interactive review.
SciChart’s documentation and examples helped. The project mixes conventional waveform plots with a less typical heatmap-based physiological view.
How the Monitoring Pipeline Works
The wearable sensor sends ECG data to the Android app over Bluetooth. The app converts device-specific data into a common internal ECG format. From there, the same signal feeds several parts of the app:
- The SciChart ECG display.
- R-peak and heart-rate analysis.
- ECM calculation, which feeds the SciChart heatmap.
- EDF recording.
- Event and annotation handling.
Telling a Dropout From a Noisy Signal
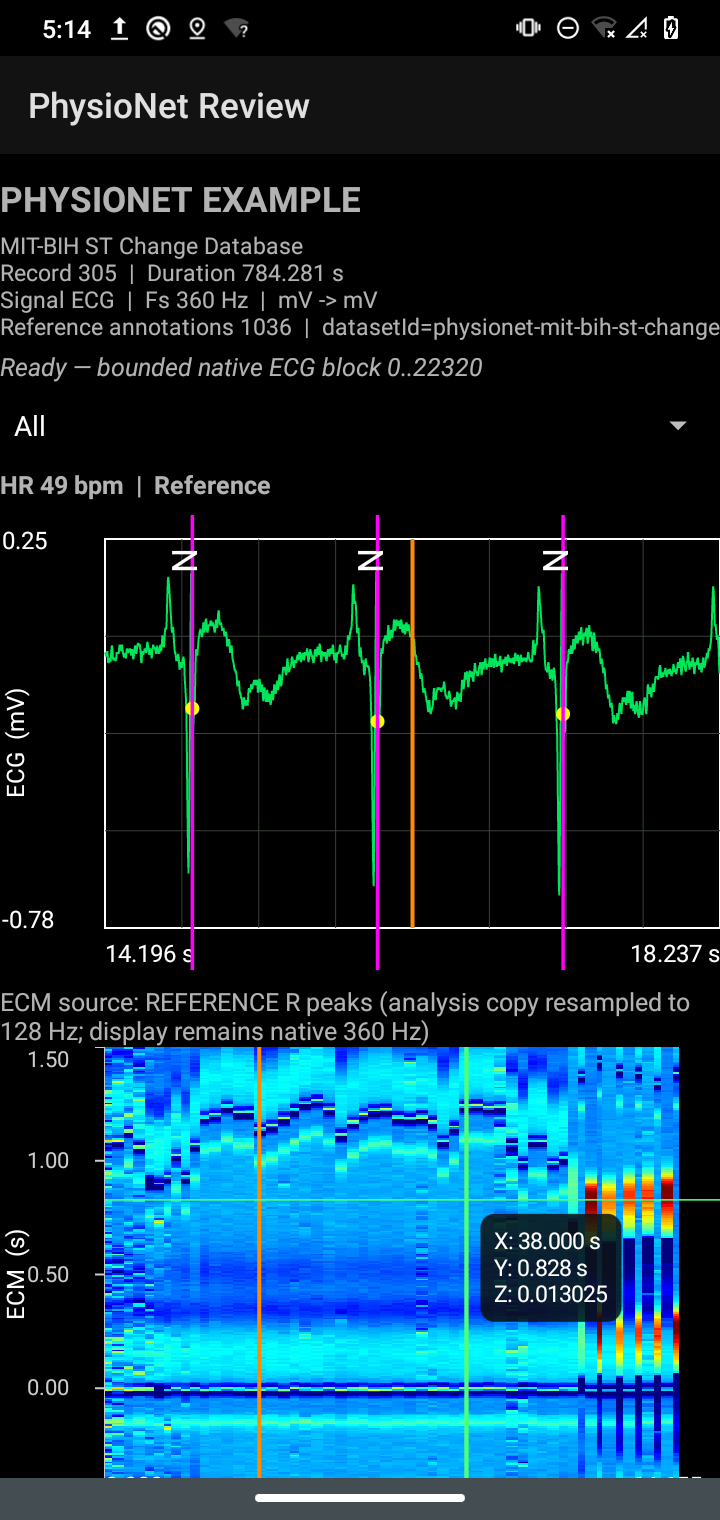
Long-duration testing with a real wearable sensor turned up two problems that looked related.
In some periods, the ECG stream was interrupted, leaving gaps in the timestamps. In others, data kept arriving, but the waveform quality dropped. Motion and electrode-contact effects were behind it.
The team viewed the ECG waveform and ECM behavior next to its recording diagnostics. That made the difference clear. It could separate transport interruptions from signal-quality problems.
“Being able to inspect the waveform and ECM behavior alongside our recording diagnostics helped us separate transport interruptions from signal-quality problems.”
Gaoyuan Zhou, Shenzhen University of Advanced Technology
Keeping Memory in Check During Long Recordings
The same testing exposed a second issue. Keeping the full ECM history in memory made memory use climb during long recordings.
The team redesigned the app around bounded live display windows. Historical data now loads on demand for review. That made the architecture much better suited to long-duration monitoring.
“Chart performance is not only about the rendering library: the application also has to manage its data correctly.”
Gaoyuan Zhou, Shenzhen University of Advanced Technology
The Result
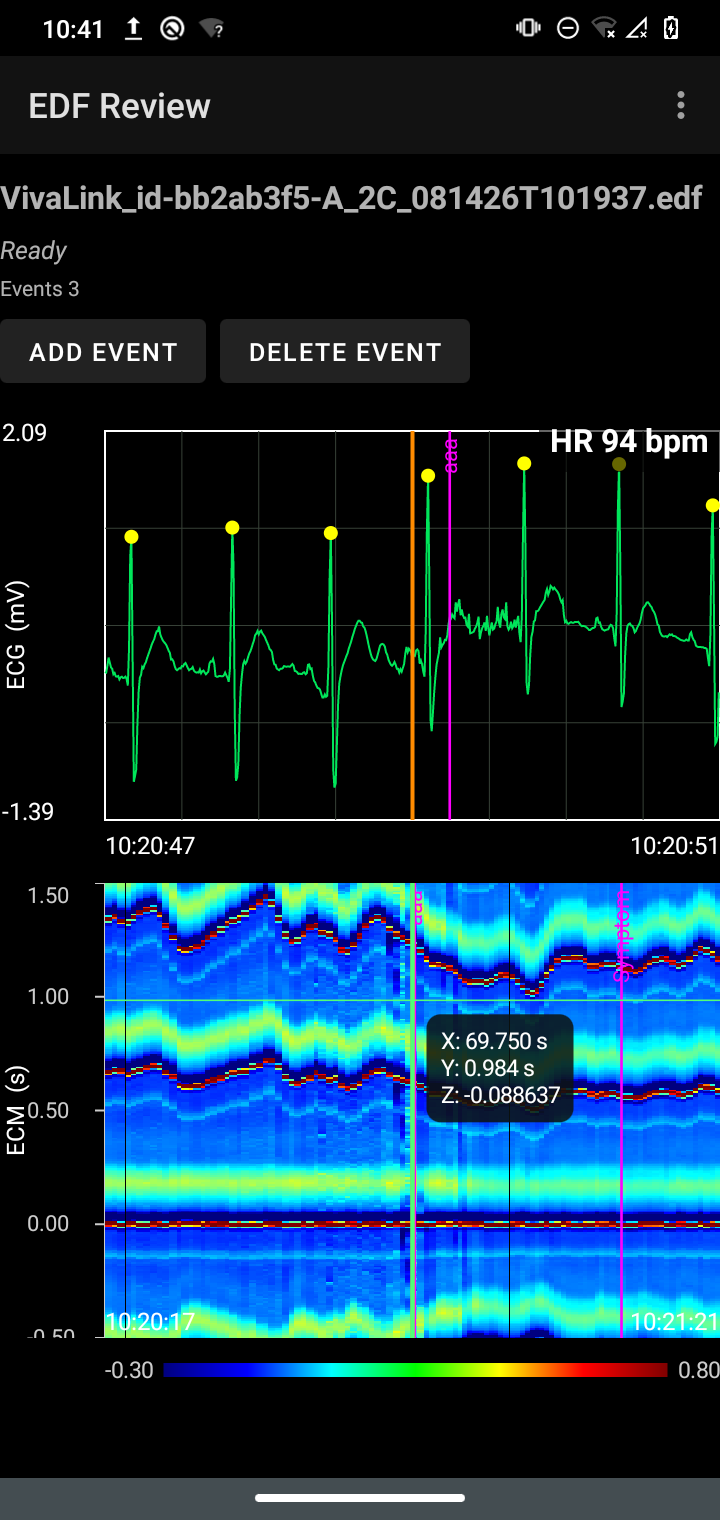
SciChart helped the team move from a basic ECG prototype to a much more usable monitoring interface. The ECG and ECM views now work together.
The app shows live ECG while analysis and EDF recording run in parallel. The same recordings reopen in Review Mode for interactive inspection.
The team has also added:
- Synchronized time navigation.
- Event markers.
- Heatmap inspection.
- Configurable viewing ranges.
It did this without building a plotting engine from scratch.
“I would describe the benefit not simply as ‘faster charts’, but as having a capable visualization layer that lets us concentrate engineering effort on the physiological data pipeline, reliability, and user workflow.”
Gaoyuan Zhou, Shenzhen University of Advanced Technology
What’s Next for the Project?
The next stage is more long-duration device validation. The team will also investigate remote-monitoring integration.
That work includes real-time telemetry and cloud-based EDF archival. It also includes a physician-facing monitoring interface.
Why the Team Uses SciChart
- One framework for waveforms and heatmaps: Live ECG line charts and ECM heatmaps run on the same chart engine.
- Built for continuously updating signals: The ECG chart updates at 128 samples per second while analysis and recording run alongside it.
- Synchronized views: ECG and ECM charts stay aligned in time, both live and in Review Mode.
- Interaction for long recordings: Zooming, panning, configurable axes, annotations, and event markers support detailed review.
- Less infrastructure to maintain: The team focuses on its data pipeline instead of a custom rendering engine.
- Helpful documentation: Examples cover both standard waveforms and less typical heatmap views.
SciChart for Biomedical Signal Visualization
SciChart Android brings real-time line series, heatmaps, and interactive review into one native charting framework. Research and engineering teams can spend their time on the signal, not the rendering.
Try SciChart Android Get in Touch