For some reason SciChart cannot render two VerticalLineAnnotation bound to to the viewmodel. 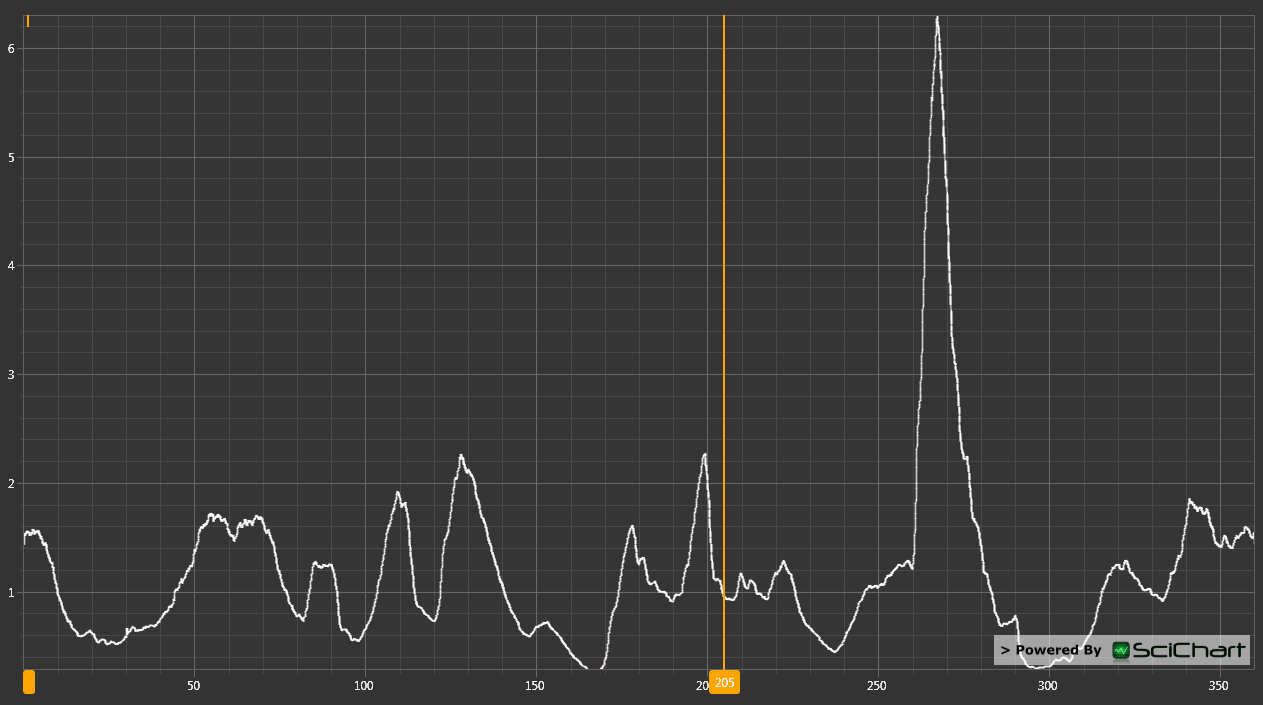
I have the following xaml
    <sciChart:SciChartSurface.Annotations>
                            <sciChart:VerticalLineAnnotation VerticalAlignment="Stretch" FontSize="12" FontWeight="Bold" ShowLabel="True" Stroke="Orange" StrokeThickness="2" X1="{Binding Data.Region.Right}"/>
                            <sciChart:VerticalLineAnnotation VerticalAlignment="Stretch"  FontSize="12" FontWeight="Bold" ShowLabel="True" Stroke="Orange" StrokeThickness="2" X1="{Binding Data.Region.Left}"/>
                        </sciChart:SciChartSurface.Annotations>
When I place hardcoded values it works. And the first of the vertical line annotation always gets rendered correctly. Seems like a bug to me.
Images

- nitroxn asked 11 years ago
- You must login to post comments
Hi there,
Ok I’ve tried to reproduce this on our side and I’m afraid I can’t (please see attached). In this example the two VerticalLineAnnotations are bound to properties in a view model. You can try commenting out the OnPropertyChanged and it still works.
Can you help us reproduce? It may be something subtle with the semantics of the A.B.C.D binding.
Best regards,
Andrew
MainWindow.xaml
<Window x:Class="WpfApplication1.MainWindow"
        xmlns=" http://schemas.microsoft.com/winfx/2006/xaml/presentation"
        xmlns:x=" http://schemas.microsoft.com/winfx/2006/xaml"  xmlns:wpfApplication1="clr-namespace:WpfApplication1"
        xmlns:s=" http://schemas.abtsoftware.co.uk/scichart"
        Title="MainWindow" Height="350" Width="525">

    <Window.Resources>
        <wpfApplication1:MainViewModel x:Key="vm" Left="1.23" Right="4.56"/>
    </Window.Resources>
    <Grid DataContext="{StaticResource vm}">
        <s:SciChartSurface>
            <s:SciChartSurface.YAxis>
                <s:NumericAxis/>
            </s:SciChartSurface.YAxis>
            <s:SciChartSurface.XAxis>
                <s:NumericAxis/>
            </s:SciChartSurface.XAxis>

            <s:SciChartSurface.Annotations>
                <s:VerticalLineAnnotation VerticalAlignment="Stretch" FontSize="12" FontWeight="Bold" ShowLabel="True" Stroke="Orange" StrokeThickness="2" X1="{Binding Right}"/>
                <s:VerticalLineAnnotation VerticalAlignment="Stretch" FontSize="12" FontWeight="Bold" ShowLabel="True" Stroke="Orange" StrokeThickness="2" X1="{Binding Left}"/>
            </s:SciChartSurface.Annotations>

        </s:SciChartSurface>
    </Grid>
</Window>
MainViewModel.cs
using System.ComponentModel;
using System.Runtime.CompilerServices;

namespace WpfApplication1
{
    public class MainViewModel : INotifyPropertyChanged
    {
        private double left;

        public double Left
        {
            get { return left; }
            set
            {
                if (left == value) return;
                left = value;
                OnPropertyChanged("Left");
            }
        }


        private double right;

        public double Right
        {
            get { return right; }
            set
            {
                if (right == value) return;
                right = value;
                OnPropertyChanged("Right");
            }
        }


        public event PropertyChangedEventHandler PropertyChanged;

        protected virtual void OnPropertyChanged([CallerMemberName] string propertyName = null)
        {
            PropertyChangedEventHandler handler = PropertyChanged;
            if (handler != null) handler(this, new PropertyChangedEventArgs(propertyName));
        }
    }
}
Images

- Andrew Burnett-Thompson answered 11 years ago
 The only thing we are doing different is displaying the graph using a data template and displaying it in a contentpresenter. I will re-examine this code one more. Thanks for the quick help again.
 I tried with same code above. It worked fine. However, I am not sure what should be the X1 value if my x-axis is DateTimeAxis. Please help
 If the XAxis is a DateTimeAxis, then X1 should be a DateTime. If the XAxis is a NumericAxis, then X1 should be a Double. If the XAxis is a CategoryDateTimeAxis then X1 should be an integer (index to data) Hope this helps!
- You must login to post comments
Your Answer
Please login first to submit.
