Hi,
I want to make a PointMarker with Elipse and ZValue next to it, for instance as below

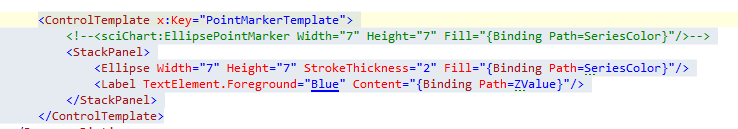
Is it possible to bind ZValue to Label and SeriesColor to Ellipse? I’ve tried different binding approaches but no luck and I am wondering if it is possible at all?
Thanks,
Charith


- You must login to post comments
UPDATE: SciChart v4.0
We now support this natively using the Custom PointMarker and PointMetadata API. You can see a full example of this API here:
WPF Chart Series with Metadata Example

- Andrew Burnett-Thompson answered 8 years ago
- You must login to post comments
Hi Charith,
A point marker (e.g. for a Scatter Series), or annotation?
PointMarkers are implemented using our own proprietary rendering engine (not WPF) so do not support complex templates with binding. Only the visual aspects. You could put a label and point, but the label would not be dynamic (Would not update the actual value with the binding).
Another alternative is to create a custom Annotation. We have a 1-point and 4-point annotation base class that you can override. The 1-point is CustomAnnotation, please see the Trade Markers example in our examples suite which shows how to do this. The 4-point annotation is BoxAnnotation, which can be templates.
Is this something you can use?
Best regards,
Andrew
- Andrew Burnett-Thompson answered 10 years ago
 Hi Andrew, Yes, that using Annotations is a possible solution for us and it works. Thanks, Best Regards, Charith
- You must login to post comments
Please login first to submit.
