
When Performance Becomes Product-Critical, the Rendering Engine Matters
- 100 million – 1 billion data points
- Sub-10 ms draw times
- Real-time interaction
Want to See SciChart in Action?
Book a free, no-obligation software demo or start a free trial, and discover how SciChart can transform your projects.



Validate SciChart’s Chart Performance
Compare rendering speed, interaction latency, and memory across:
- Real hardware
- CPU and GPU pipelines
- Multiple chart types, workloads, and datasets
- Reproducible benchmarks with results that show real-world impact
 Performance Ranking Table
Choose a Processor
| Rank | Library | Score | Fastest Wins *Based on 13 benchmark tests performed | ||||
|---|---|---|---|---|---|---|---|
| 1 | SciChart.js | 48 | 8.5 | 9 | 8.5 | 4 | 0 |
| 2 | LCJS v8 | 31 | 0.8 | 1.8 | 0.8 | 0.5 | 0 |
| 3 | LCJS v4 | 20 | 0.8 | 0.3 | 1.3 | 2 | 0.8 |
| 4 | uPlot | 14 | 0.8 | 0.8 | 0.5 | 3 | 4.3 |
| 5 | Plotly.js | 12 | 0.8 | 0 | 0.5 | 0 | 1 |
| 6 | Highcharts | 9 | 0 | 0 | 0 | 0 | 0 |
| 7 | Apache ECharts | 8 | 0.5 | 0 | 0.5 | 2 | 0.3 |
| 8 | ChartGPU | 5 | 0.3 | 0.8 | 0.3 | 1 | 0 |
| 9 | Chart.js | 3 | 0 | 0 | 0 | 0.3 | 3.3 |
| 10 | Lcjs | 1 | 0.8 | 0.5 | 0.8 | 0.3 | 0 |
| Rank | Library | Score | Fastest Wins *Based on 13 benchmark tests performed | ||||
|---|---|---|---|---|---|---|---|
| 1 | SciChart.js | 56 | 7 | 8 | 7 | 5 | 0 |
| 2 | LCJS v8 | 40 | 1 | 3 | 1 | 1 | 0 |
| 3 | LCJS v4 | 24 | 1 | 0 | 2 | 3 | 0 |
| 4 | ChartGPU | 23 | 1 | 2 | 1 | 2 | 0 |
| 5 | uPlot | 20 | 0 | 0 | 0 | 1 | 0 |
| 6 | Plotly.js | 14 | 1 | 0 | 1 | 0 | 0 |
| 7 | Apache ECharts | 13 | 0 | 0 | 0 | 1 | 0 |
| 8 | Highcharts | 10 | 0 | 0 | 0 | 0 | 0 |
| 9 | Chart.js | 4 | 0 | 0 | 0 | 0 | 0 |
| 10 | Lcjs | 0 | 2 | 0 | 1 | 0 | 0 |
| Rank | Library | Score | Fastest Wins *Based on 13 benchmark tests performed | ||||
|---|---|---|---|---|---|---|---|
| 1 | SciChart.js | 43 | 9 | 7 | 9 | 4 | 0 |
| 2 | LCJS v8 | 29 | 2 | 2 | 2 | 1 | 0 |
| 3 | LCJS v4 | 18 | 0 | 0 | 0 | 0 | 1 |
| 4 | ChartGPU | 16 | 0 | 1 | 0 | 2 | 0 |
| 5 | Plotly.js | 11 | 1 | 0 | 0 | 0 | 2 |
| 6 | uPlot | 10 | 0 | 1 | 0 | 3 | 6 |
| 7 | Highcharts | 10 | 0 | 0 | 0 | 0 | 0 |
| 8 | Apache ECharts | 7 | 0 | 0 | 0 | 2 | 0 |
| 9 | Chart.js | 4 | 0 | 0 | 0 | 0 | 4 |
| 10 | Lcjs | 0 | 1 | 2 | 2 | 1 | 0 |
| Rank | Library | Score | Fastest Wins *Based on 13 benchmark tests performed | ||||
|---|---|---|---|---|---|---|---|
| 1 | SciChart.js | 53 | 9 | 11 | 9 | 4 | 0 |
| 2 | LCJS v8 | 31 | 0 | 1 | 0 | 0 | 0 |
| 3 | LCJS v4 | 24 | 1 | 1 | 1 | 2 | 1 |
| 4 | Plotly.js | 16 | 1 | 0 | 1 | 0 | 2 |
| 5 | uPlot | 14 | 1 | 0 | 1 | 3 | 6 |
| 6 | Highcharts | 10 | 0 | 0 | 0 | 0 | 0 |
| 7 | Apache ECharts | 8 | 1 | 0 | 1 | 4 | 0 |
| 8 | Chart.js | 3 | 0 | 0 | 0 | 0 | 4 |
| 9 | ChartGPU | 0 | 0 | 0 | 0 | 0 | 0 |
| 10 | Lcjs | 0 | 0 | 0 | 0 | 0 | 0 |
| Rank | Library | Score | Fastest Wins *Based on 13 benchmark tests performed | ||||
|---|---|---|---|---|---|---|---|
| 1 | SciChart.js | 42 | 9 | 10 | 9 | 3 | 0 |
| 2 | LCJS v8 | 26 | 0 | 1 | 0 | 0 | 0 |
| 3 | LCJS v4 | 15 | 1 | 0 | 2 | 3 | 1 |
| 4 | uPlot | 14 | 2 | 2 | 1 | 5 | 5 |
| 5 | Plotly.js | 9 | 0 | 0 | 0 | 0 | 0 |
| 6 | Apache ECharts | 7 | 1 | 0 | 1 | 1 | 1 |
| 7 | Highcharts | 7 | 0 | 0 | 0 | 0 | 0 |
| 8 | Chart.js | 2 | 0 | 0 | 0 | 1 | 5 |
| 9 | ChartGPU | 0 | 0 | 0 | 0 | 0 | 0 |
| 10 | Lcjs | 0 | 0 | 0 | 0 | 0 | 0 |
Choose Metric

Scores by processor:
Score = Σ(composite × weight) / Σ(weight)
Composite = (FPS×65% + InitTime×20% + Frames×10% + Memory×5%) × 100
Metrics use power transformation to amplify performance differences:
- FPS^1.5: Exponentially rewards higher FPS (42 vs 4.77 FPS → 272 vs 10.4 = 26x scoring difference)
- Frames^1.5: Higher frame counts exponentially better
- Init Time: Linear scale (lower is better)
- Memory: Linear scale (lower is better)
- Weight = [log₁₀(points × series × charts)]^3.5
Aggressive polynomial weighting ensures complex tests contribute exponentially more (16M points >> 1K points).
Failed/skipped tests receive 0 score but full weight penalty.
Average scores:
Average scores are calculated by getting Geometric Mean instead of simply averaging them
∜ (sM1 × sSnapdragon × si9 × sRPi5)
Fastest Wins
The "Fastest Wins" metric represents the total number of times a library achieved the highest score across all thirteen test cases for each processor.
Average Fastest Wins
Building upon the Fastest Wins metric, this figure reflects the aggregated total of fastest wins across all tested processors.

Test the Performance Yourself
Run the benchmark, validate against your workload, or talk to us about your project
Performance Doesn’t Start at First Render
Is your team reducing data or removing features to avoid lagging data visualizations? With SciChart, you can skip the workarounds and achieve your project’s full potential.
The Cost of Choosing the Wrong Chart Library
Choosing the wrong rendering engine doesn’t just slow the odd feature here and there, it compromises your whole product.
- Fast first load means nothing under real load.
- Problems show up later as interaction lag, frame drops, and memory creep.
- Common issues include redesigns, delivery risk, and CPU/GPU capacity wasted on charting instead of analytics.
- The right charting architecture helps avoid future bottlenecks.
With most chart libraries you may experience these common problems:


SciChart is Built Differently.
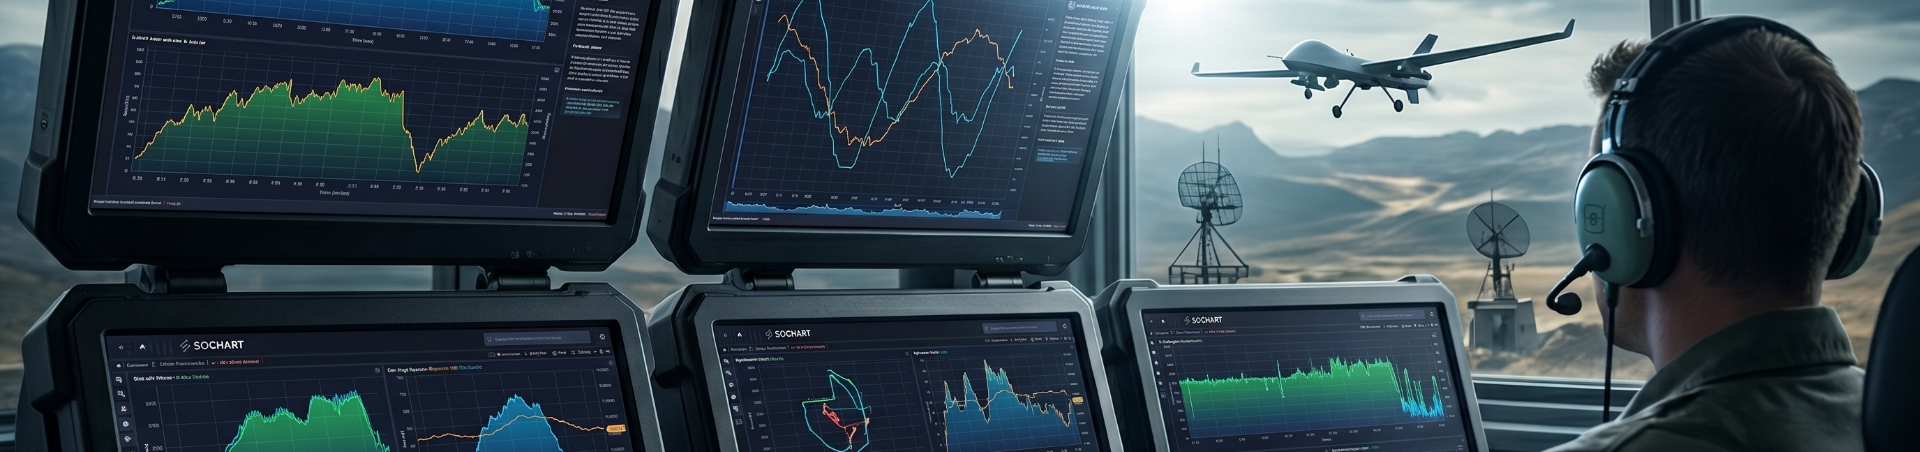
In a UAV telemetry system, refresh rates moved from seconds to ~4ms. The product shifted from post-event analysis to real-time operation.

Visualize Extreme Data Volumes Without Post-Processing
Efficient, raw data performance comes from the rendering engine, not the API. SciChart runs on Visual Xccelerator™, a purpose-built C++ engine deployed via WebAssembly.
- Optimized CPU and GPU utilization supports over 100 million data points at 60 FPS
- Native 64-bit precision with deterministic, repeatable rendering
- Designed for continuous, long-running workloads
- Consistent rendering behavior, even under continuous load, across web, desktop, and mobile
- Zooming and annotations stay smooth across heavy, multi-series datasets.
- Executes outside standard browser rendering paths, avoiding DOM, garbage collection, and UI-thread bottlenecks
- Lower hardware demands and optimized system resource allocation make SciChart ideal for mobile, embedded, and cost-sensitive applications
- Full dataset visibility and no simplification, across combined workloads including interaction, overlays, and multi-pane analysis




Where SciChart is Used
SciChart’s rendering engine is used by all the leading F1 teams, 90% of the world’s top medical device companies, and popular financial and trading organizations. With our performance possibilities, we help businesses engineer truly pioneering products, applications, and data insights.


Book a Demo Today
Book a demo and discover why we are the choice
of demanding developers worldwide
"*" indicates required fields