We are pleased to announce the release of SciChart WPF v5.3, build 11899 . This is a minor update which includes a number of bug fixes, improvements, and new features. It is strongly advised for users of SciChart v5.x to upgrade to this version, which is a drop-in replacement.
What’s New in SciChart WPF v5.3?
New features
WPF Chart Animation Functions
SciChart’s WPF Chart now features a new WPF Chart Animation API. Animated WPF charts will make your applications more appealing to you and your customers.
There are four standard animation types introduced in SciChart WPF:
- Fade Animation
- Wave Animation
- Sweep Animation
- Scale Animation
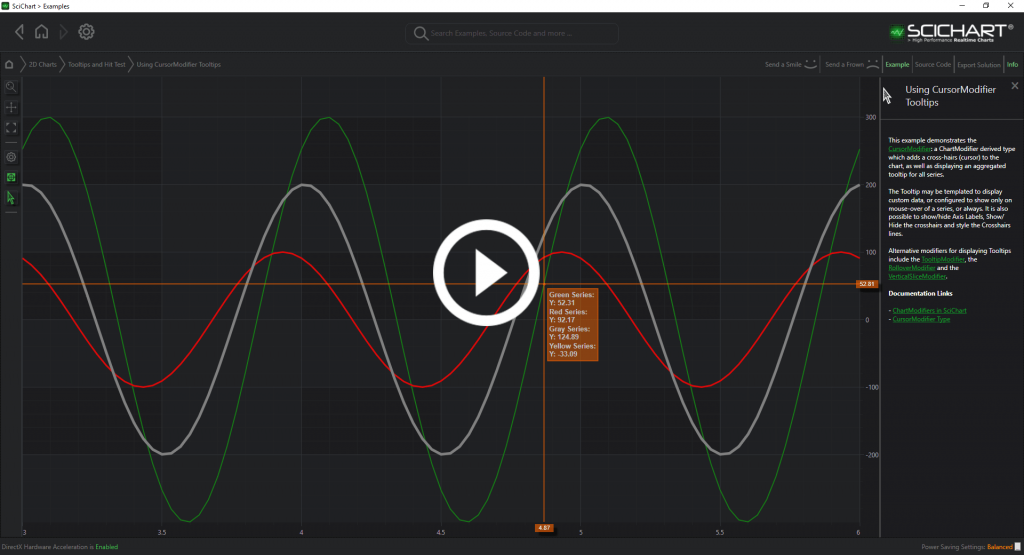
Animations have been included in several of our WPF Chart Examples. You may see them in the video below.
SciChart’s WPF Chart Animations API is made flexible so that you can control when an animation starts and stops, the animation start delay and animation duration. There are also several predefined EasingFunctions available in WPF, that would allow to further adjust the animation behaviour.
For more information, please have a look at WPF Chart Animations Documentation.
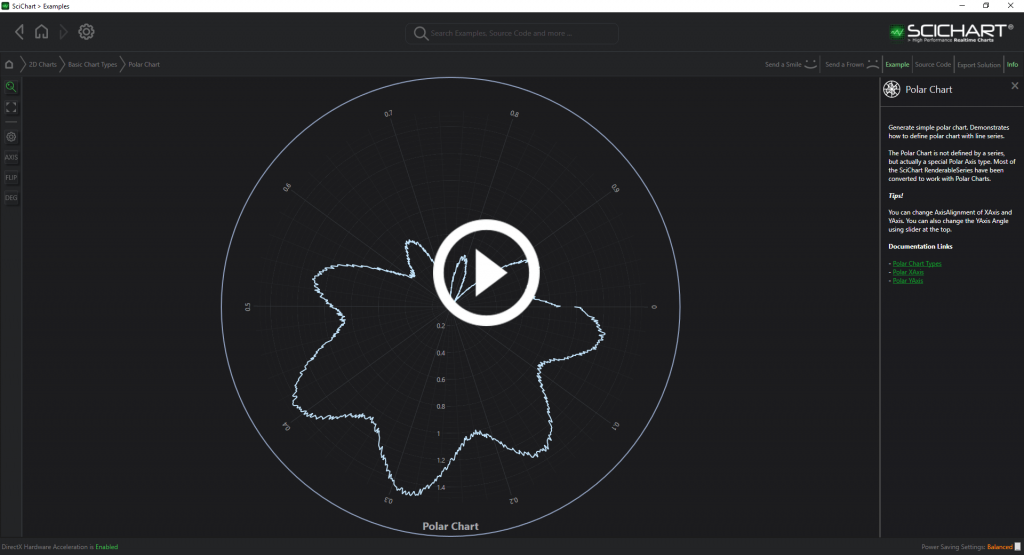
Polar Chart Rotation:
This is a new feature added to the polar chart, which will allow you to set the rotation of the Xaxis so that the zero is at any angle. This often requested feature will allow you to have polar Charts with the 0,360 degree mark at the top of the chart.
Show tooltips as popup option:
If you have lots of charts on the screen, or a small chart size, it was often reported that the tooltips would be clipped at the edge of the chart. With this new feature, you will be able to place a tooltip in a WPF popup, which will allow the tooltip to behave more like a standard WPF tooltip.
To enable tooltips to show up as popups just use the property: RolloverModifier/CursorModifier/TooltipModifier.TooltipUsageMode=”TooltipControl, Popup”.
For more information, please have a look at Popups vs. Canvas for WPF Chart Tooltips Documentation.
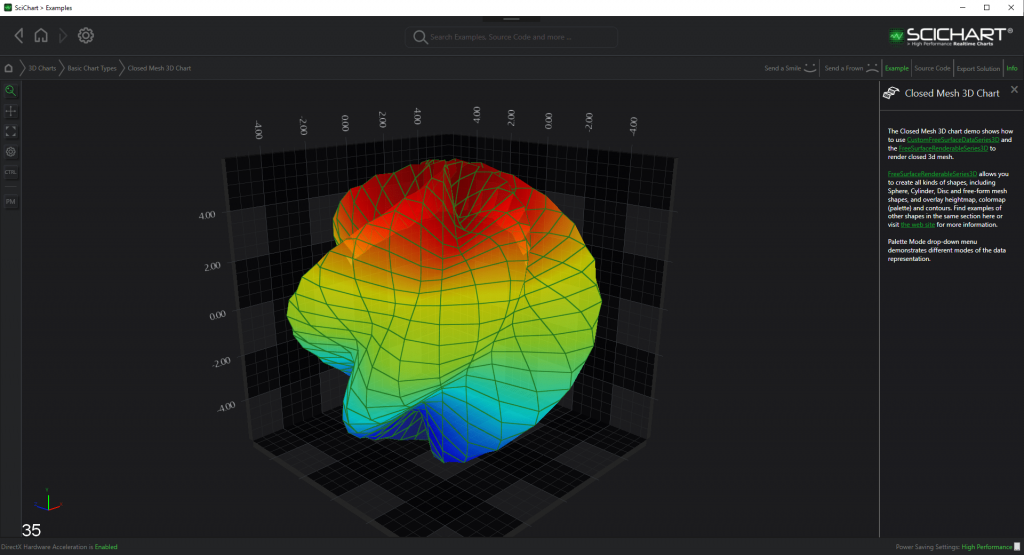
An ON/OFF option to show tick labels only on chosen planes in 3D Charts:
You may now choose which planes would be showing the tick labels in the WPF 3D charts. For examples by setting the following properties on the SciChart3DSurfcae:
<s3D:SciChart3DSurface s3D:XyAxisPlane.DrawLabelsMode="AxisPlaneDrawLabelsBoth"
         s3D:ZyAxisPlane.DrawLabelsMode="AxisPlaneDrawLabelsLocalX"
         s3D:ZxAxisPlane.DrawLabelsMode="AxisPlaneDrawLabelsHidden">
   ...
</s3D:SciChart3DSurface>
For more information, please see the documentation for Showing Axis Labels on one side of the 3D Chart.
Bug Fixes
Almost 50 bugs and minor issues have been addressed in v5.3 since the last stable release. Bug fixes are shipped first in our nightly builds and are bundled up and tested for stable releases.
- Fixed the issue with scrolling when DiscontinuousAxis is used
- Fixed Static axes with changed MinorMajor delta takes no effect and no re-drawing.
- Fixed SC-4747 BorderThickness and BorderBrush missed when export with clone
- Fixed the issue when a Scrollbar would jitter if the track dragged when stuck at either end of the scroll area
- Removed TypeMarkupExtension and FasterRandom has been moved to SciChart.ExternalDependencies. This removes all CPOL code from the commercial SciChart library
- Removed class LayoutTransformer due to CPOL Open Source license objection by one of our customers. Have used default WPF ‘LayoutTransform’ instead
- Removed s:Static markup extension (CPOL) Open Source license objection by one of our customers. Have used default WPF x:Static instead
- Changed DataContext of child annotations in TradeAnnotations
- Fixed annotations not exported when VerticalSliceModifier added
- Fixed SC-4759 where VerticalLineAnnotation with String LabelValue would throw with a TimeSpanAxis
- Fixed SC-4758 duplicate AnnotationLabels when removing and then add same annotation instance in MVVM
- Fixed Directx 2D Bubbles when they are big, refactor to use just one TEX Coords
- Fixed broken touch for ZoomPan, DragAxisModifier, HeatmapColormap drag CustomModifiers derived ChartModifierBase.
- Fixed the DirectX Bubbles quality issue
- Fixed missed Axis properties not exported due to custom bindings.
- RotationAngle property added to PolarXAxis
- Fixed SC-4766 issue when resampling didn’t consider whether the chart is vertical the or not when reducing points
- Added missing properties (MaxBubbleSizeInPixels and ApplyAreaSizingInsteadOfRadius) to BubbleRenderableSeriesViewModel
- Fixed wrong XRange calculation inside StackedColumnsWrapper
- Fixed the issue in MouseManager to make events propagated to Master first
- Fixed for ZoomExtents when CategoryAxis and one RenderableSeries is hidden
- Added scaling functionality for MajorMinor GridTick lines of an axes
- Fixed Grid and Tick lines of axes not scaled after Export
- Fixed PointMarkers not scaled after Export
- Added quick fix for SC-4775 crash in ExtremeResamplers with FifoBuffer;
- Fixed ZoomPanModifier not worked without PinchZoomModifier enabled with touch;
- Fixed AxisDrag modifiers not working without PinchZoomModifier or ZoomPanModifier with touch;
- Fixed HeatmapColorMap dragging not worked with touch;
- Fixed VerticalSliceModifier
- Made BaseRenderableSeries.DrawLines method virtual and protected
- Fixed SC-4770 TimeSpanLabelProvider throws with ‘Input string was not in the correct format’
- Fixed shader compile error
- Fixed for 1 px lines,
- Fixed SC-4782 StackedColumns shrinking when one series is hidden
- Added an option to ON/OFF presenting tick labels on the single side of an Axis 3D
- Fixed ChartTitleStyle for SciChartSurfaceBase.Export
- Fixed SC-4783 issue when changing Opacity on a series wouldn’t have any impact on filled series
- Changed the template of SciChartSurface so that ChartTitleStyle can be used to style a title
- Made UpdatePosition method virtual in AnnotationBase
- Fixed SC-4800 issue when hit-test would work incorrectly before gaps with DiscontinuousAxis
- Added Popup mode for Modifier Tooltips
- Added OnAttached, OnDetached methods to IRenderableSeries;
- Removed reference on Charting.DrawingTools.dll from ExternalDependencies
- Fixed SC-4741 issue with blinking and redrawing modifier popups
- Fixed SC-4809 AxesCollection memory leak (MVVM)
- Fixed SC-4803 CategoryAxis regression – Rollover works incorrectly when interpolated
- Fixed Selected PointMarkers for ExtremeRenderableSeries
Where to Get SciChart WPF v5.3?
SciChart WPF v5.3 is available from:
- By downloading from our scichart.com/downloads page
- By Install-Package or Update-Package from NuGet. Please note that as of July 5th, we have changed our NuGet nightly builds and package policy. We encourage you to use the official releases from our abtsoftware feed.
- By cloning or downloading the source code on Github (source code customers only).
Please ensure you uninstall the previous version(s) of SciChart before installing v5.3 as this can prevent some issues in the upgrade process!
Best regards,
SciChart team
Related Posts


