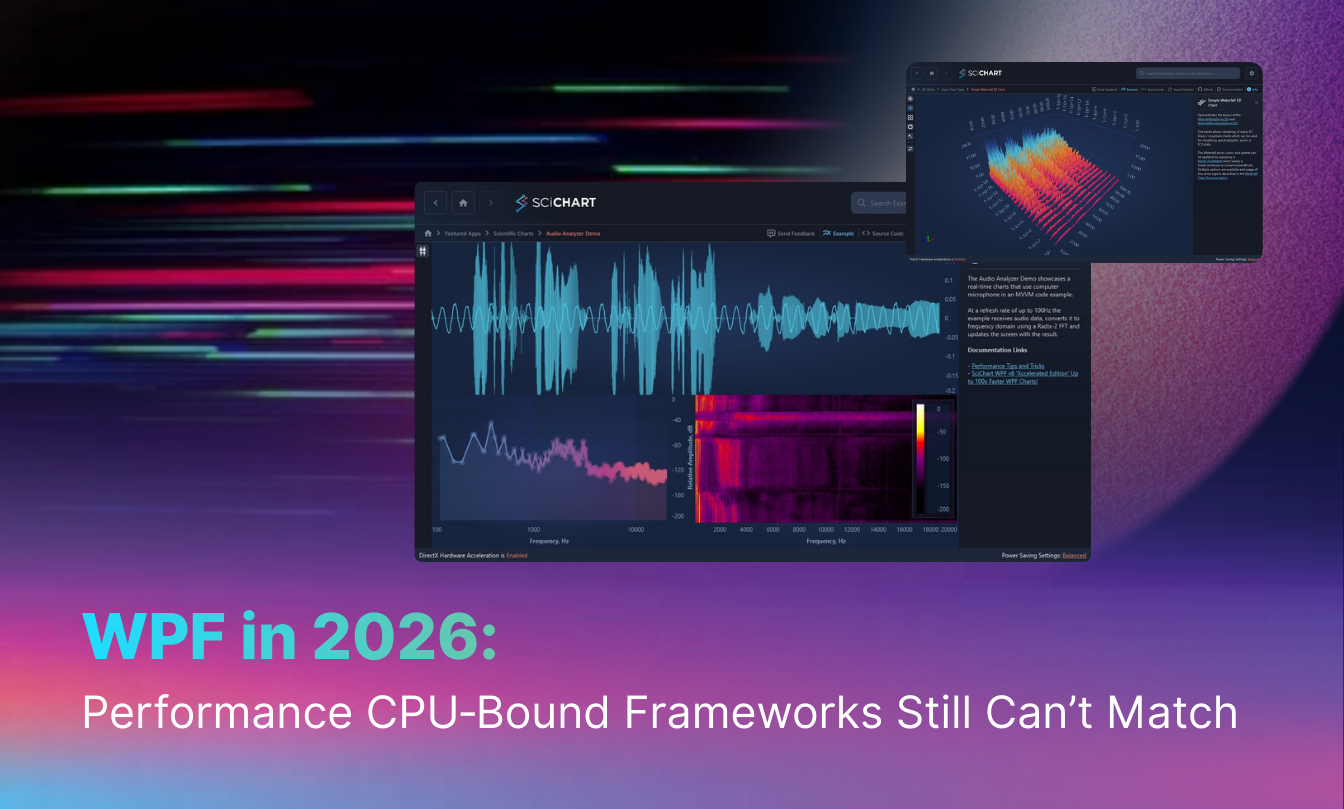
WPF vs Avalonia: Which Is Best in 2026?
Discover whether WPF or Avalonia XPF is the right choice for your high-performance data visualization needs in 2026.
Is WPF dead? I hear it all the time. Critics claim the web swallowed everything, yet here we are in 2026, and the most vital systems on the planet still rely on Windows Desktop. Why? Because when you’re monitoring a patient’s heart during surgery or managing a national power grid, a “pretty good” frame rate doesn’t cut it. You need something that won’t blink.
Many developers still evaluate a charting tool by asking how many data points it can draw, or how many frames per second it can hit in a synthetic test. But real-world applications, especially those built on WPF, place far more demanding requirements on the visualization layer.
In sectors like MedTech, aerospace, and trading, performance is the difference between a successful mission and a total disaster. WPF remains a top performer because it gives us what the browser can’t – total control over the metal.
I’ve seen so many teams fall into the same trap. They pick a charting tool because it looks fast in a demo. Then they hook it up to a real-time stream and the whole UI locks up. Drawing points is the easy part. What’s not so easy is maintaining 100 million data points without lag while the user zooms, pans, and adds analytical overlays. That’s where frameworks fall apart.
CPU‑bound chart engines quickly saturate the UI thread, leading to jitter, freezes and delayed input.
“Every abstraction has a cost. The browser’s cost is that you’re sharing a runtime with whatever tabs the user has open. For a content site, that’s fine. For real-time, mission-critical workloads, it’s disqualifying. I think the best argument for native desktop development is that nobody ever asks, ‘Why is this so fast?’ They only notice when it isn’t.” Mike James, CEO of Avalonia.
Let’s talk about the elephant in the room: the WPF Dispatcher. It’s a single-threaded bottleneck. If your chart is burning CPU cycles to calculate where a line goes, your buttons stop clicking and your animations start stuttering. It’s a frustrating mess.
This is why we built the Visual Xccelerator™ engine. By offloading coordinate transforms and resampling to the GPU, we leave the UI thread free for interaction and business logic. This preserves smooth performance even during high‑frequency updates.
GPU gives your data visualization projects a power boost. Let’s say you wanted to build a moat. You could use a shovel (the CPU), or you could use a fleet of heavy-duty diggers (the GPU). One gives you a faster, more efficient means to an end, while the other is laborious and likely to take too long or be abandoned altogether.
The result of GPU acceleration is a UI that stays sharp even while processing hundreds of thousands of updates every single second.
C# continues to be widely used among professional developers, reflecting ongoing investment in .NET desktop technologies such as WPF. Community growth around Avalonia XPF highlights the trend toward cross‑platform WPF‑style development – reinforcing that XAML‑first desktop tooling remains highly relevant in 2026.
According to the 2025 Stack Overflow Developer Survey, C# remains a top-tier language, used by 27.8% of all respondents and 29.9% of professional developers. This indicates a stable base for .NET-based frameworks like WPF.
Despite its age, it’s still estimated that there are as many as 1 million actively developed WPF applications worldwide as of late 2024/early 2025.
The health of a framework is often measured by its community activity. Data from GitHub showed that Avalonia XPF had a healthy level of downloads and repository stars (a 25% increase in 2024).
I’ve noticed a trend where newer libraries use float32 to save memory. That’s fine for a fitness tracker, maybe. But in aerospace or defense? Float32 introduces rounding errors that can move your data points and result in rounding drift at deep zoom levels. If you’re zooming into a nanosecond-scale timestamp, you need float64 accuracy.
SciChart WPF performs calculations in float64 while rasterizing in float32 where appropriate, preserving precision without sacrificing GPU performance.
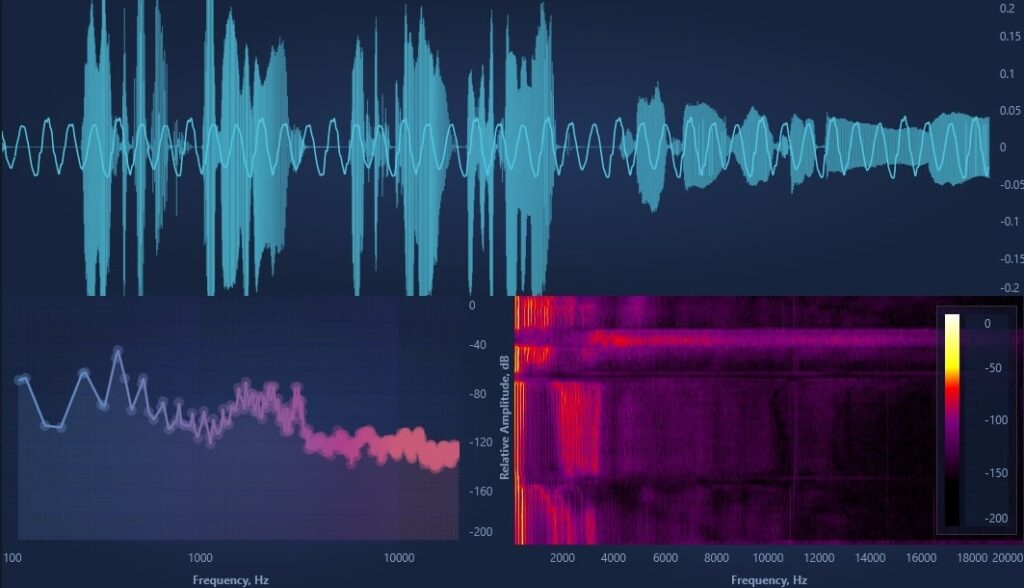
WPF Audio Analyzer Example
Even with GPU offloading, the initial data preparation phase can become a bottleneck if not handled correctly. This is where Single Instruction, Multiple Data (SIMD) optimizations become crucial. These optimized code paths significantly increase throughput before the GPU rendering stage begins.
By leveraging modern CPU vector instruction sets (AVX, AVX2, and AVX‑512 where supported), the engine can perform mathematical operations on multiple data points simultaneously rather than processing them one by one. This vectorized approach is what separates academic exercises from industrial-grade tools.
When calculating coordinate bounds or performing hit-testing on massive datasets, SIMD-tuned code paths can offer a ten-fold increase in throughput. This ensures that the pre-processing stage never delays the hand-off to the Visual Xccelerator™ engine, maintaining a seamless flow from raw telemetry to pixels.
Real data can be messy. It’s unsorted and can arrive in irregular bursts. A high-performance engine should handle the chaos without losing a single peak or trough. That’s where adaptive resampling comes in. Instead of just throwing away every tenth point – which is a great way to miss a critical heartbeat spike – we use lossless algorithms to compress millions of points into a visually perfect representation in milliseconds. Our min/max‑preserving resampling approaches are inspired by LTTB and MinMax‑LTTB.

WPF Vital Signs ECG/EKG Medical Demo
To achieve these speeds, a modern engine must move beyond simple single-pass drawing. Multi-stage rendering breaks the visual pipeline into specialized phases: data ingestion, geometric transformation, and final composition.
By decoupling the data update rate from the screen refresh rate, the system can process millions of incoming signals in the background while the GPU independently handles the heavy lifting of drawing lines and shapes.
This prevents the all-or-nothing rendering cycles that plague traditional libraries, where a single large data update can lock the UI. Instead, each stage operates in a parallelized, cache-aware manner, ensuring that the visual output remains smooth even as the underlying data grows exponentially.
C# has a performance edge due to the nature of the language. It offers strong typing, true multi-threading, direct memory access via unsafe pointers, and more efficient handling of memory-intensive workloads through structs with predetermined layouts.
Using a multi-stage pipeline, SciChart WPF separates data ingestion, transforms and GPU composition. By decoupling update rate from render rate, large bursts of incoming data don’t freeze the UI. Each stage is optimized independently for maximum responsiveness.
WPF applications run as native 64‑bit desktop processes, which means they can use all the physical memory available on the machine – whether that’s 16GB, 64GB or even 128GB+. This is essential for industrial workloads that routinely process multi‑gigabyte datasets.
In contrast, JavaScript and WebAssembly applications inside the browser can be constrained by strict sandboxed memory limits, typically in the range of 2–4GB, regardless of how much RAM the system actually has. This cap is a fundamental architectural limitation of browser runtimes.
Most WPF apps aren’t meant to be used for five minutes. They are control room fixtures or laboratory mainstays. Because of this, the visualization layer has to be open-source friendly and backed by serious technical support. We even integrated an AI assistant to help you navigate complex configurations because, let’s be honest, big data is complicated enough.
“WPF remains favored in industrial and scientific environments because it’s a single, coherent framework with a far lower learning and operational burden. Teams don’t need to assemble and maintain an entire web stack just to build a reliable UI – you can create, run, and deploy a WPF application from one toolchain. Browser graphics keep improving, but the sandbox remains. For software that must be responsive all day, every day, determinism still favors WPF – full memory access, all cores, direct GPU, so teams can build apps quickly and efficiently in a platform and language they know and understand.” Andrew Burnett-Thompson, CEO.
When combined with SciChart’s GPU acceleration, float64 precision, SIMD optimization and adaptive rendering pipeline, WPF remains one of the most reliable platforms for real‑time, high‑fidelity desktop visualization.
SciChart’s WPF charts remains one of the most capable platforms for high-performance visualization because it offers stability, precision and the freedom to use GPU acceleration without the constraints of browser runtimes. It offers a level of deterministic, real-time performance that web sandboxes just can’t touch. If you’re building something that actually matters – something that can’t afford to lag – WPF is still the right choice.
In modern engineering, where real-time accuracy and reliability matter most, WPF is far from dead, and, if anything, can be the best option for your use case.
Recent Blogs
![]()
Queens Award for Innovation
Proud winners of the Queens Award for Innovation, 2019. Awarded on account of our innovative graphics engine which underpins the SciChart library and enables our world-beating charting performance
![]()
National Business Awards
Highly Commended for Lloyds National Business Awards, 2019. Awarded on account of our innovative graphics engine and impressive customer base
![]()
National Technology Awards
Awarded “Healthcare Tech of the Year” at the 2025 National Technology Awards – a top UK recognition for breakthrough innovation in technology.

Reviews
SciChart has received hundreds of verified, 3rd party reviews